Working with histograms
You can also view trend information in a histogram instead of in a trend graph. You can do so by drilling down on a parameter on a card to access the parameter trend information, or by going to the HISTOGRAM page of a view card.
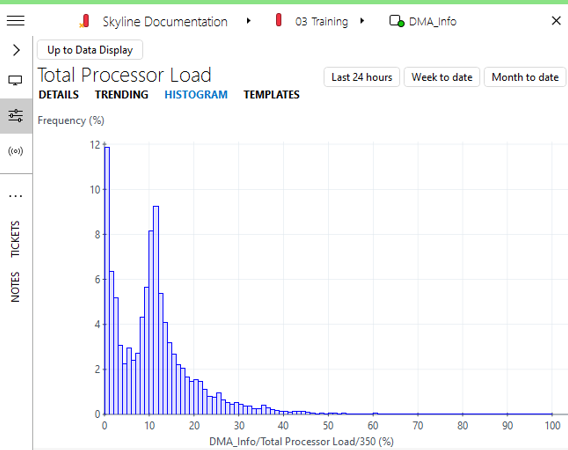
In a histogram:
The X-axis represents the parameter value, shown in intervals.
The Y-axis represents the number of times the parameter value occurred in the given time span.
The histogram right-click menu allows you to:
Change the type of Y-axis from the default setting of absolute values (the number of occurrences) to relative values (% of total occurrences), by deselecting Use absolute frequency.
Print the histogram.
Save the histogram as an image.
Copy the histogram as an image to the clipboard.
Export the histogram to a CSV file.