Cube logging
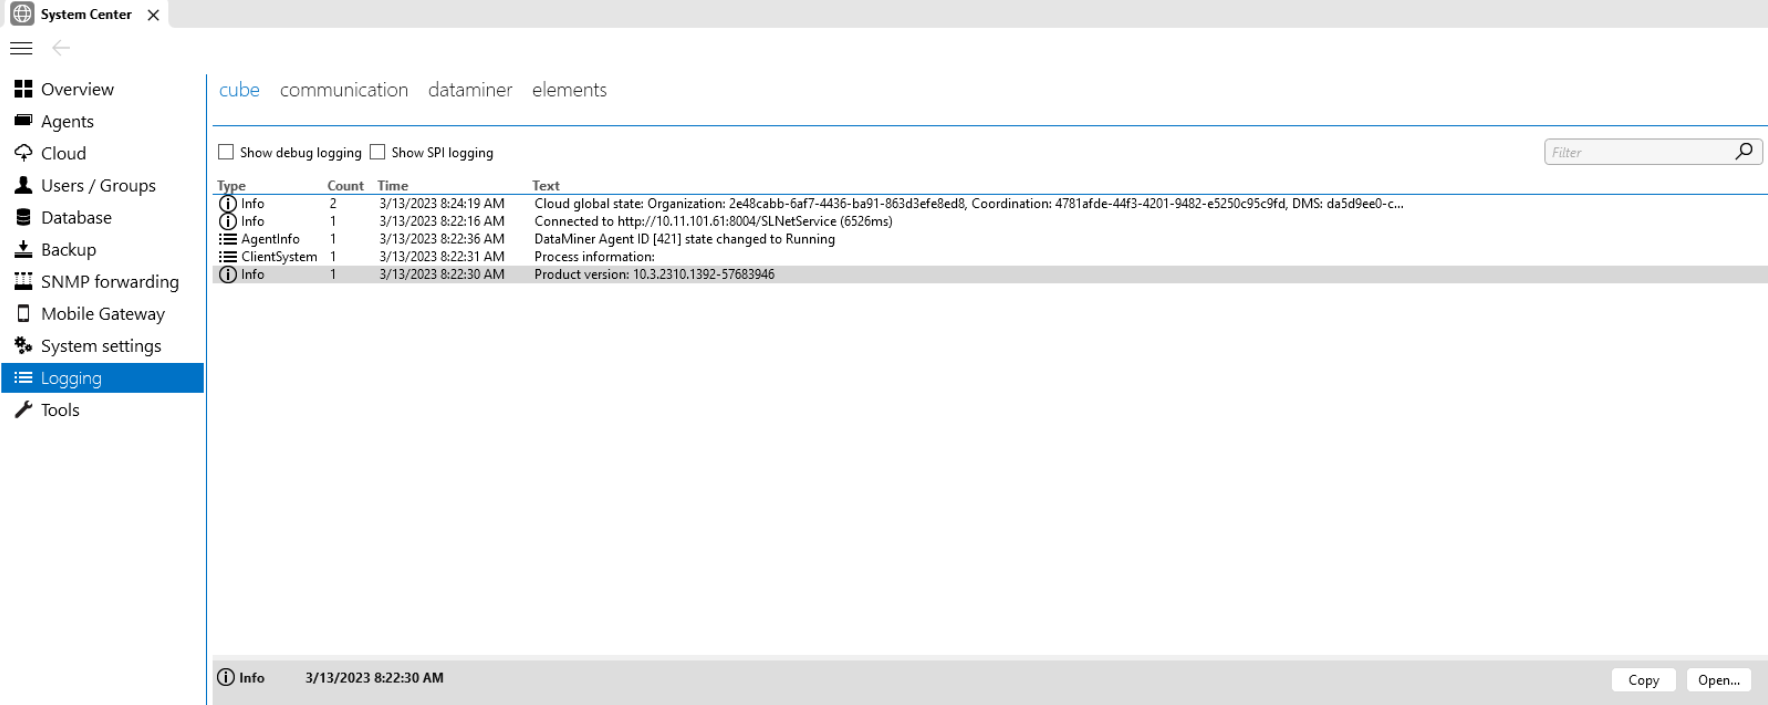
The Cube page shows internal log information related to DataMiner Cube itself.
Logging is extremely useful in order to detect, investigate, and solve issues.

Cube logging in DataMiner 10.3
Tip
Logging for the Cube start window is located elsewhere. See Consulting the start window logging.
Log file locations
For every DataMiner Cube session, both local and remote logging is created, each in a different location.
Local logging
The local logging is the logging saved on the machine where the Cube client is running. This is the version of the Cube logging that contains the most detailed information.
This logging is saved in the following location: %LocalAppData%\Skyline\DataMiner\DataMinerCube\CubeLogging\SLCubeLog_YYYY_MM_DD_HH_MM_SS_PID.txt
Note
Every time a new DataMiner Cube session starts up, any log files that are more than one week old will be removed.
Remote logging
The remote logging is the logging saved on the server to which the Cube client is connected. This version of the Cube logging is simplified and contains less information than the local Cube logging.
This logging is saved on the server. If the default installation path was used, it can be found in the folder C:\Skyline DataMiner\logging\SLClient.txt.
Log information
The log information in DataMiner Cube is displayed in a list with the following columns:
| Column | Description |
|---|---|
| Type | The type of log message, e.g. Debug, Info. |
| Count | If certain conditions are met, log items can be grouped. This column shows how many log items are grouped under this entry. |
| Time | The time when the message was logged, displayed in the format MM/DD/YYYY HH:MM:SS. |
| Text | The log message itself. |
Below the list, a details pane shows detailed information on any selected log item.
You can view additional information on the selected item by clicking the Open button in the details pane or by double-clicking the item in the list. This will open the detailed information in a pop-up window, which also contains a button that allows you to copy the information.
The following buttons at the bottom of this page allow further actions:
| Button | Functionality |
|---|---|
| Export debug information | Exports the log information as a ZIP file. |
| Email debug information | Creates an email message to DataMiner Technical Support with the log information. |
| Open log folder | Opens the folder containing the log files on the client machine. Note that Cube removes these files once they are seven days old. |
| Copy cube information | Copies the log information to the clipboard. |
Note
- Use the filter box in the top-right corner to filter the displayed information. See Using quick filters.
- By default, debug logging is not displayed. To display these log items, select the option Show debug logging at the top of the tab.
- From DataMiner 10.1.11/10.2.0 onwards, you can select the option Show SPI logging at the top of the tab to see information related to system performance indicators. By default, SPI logging is not displayed.
- When an exception is recorded in the Cube logging, this is indicated by an icon in the Cube header. Clicking the icon will open this logging section. For warnings and errors, by default no icon is displayed in the header. However, you can have such icons displayed by adding the following argument to the Cube URL:
?enablefeature=loggingnotifications
Log types
DataMiner Cube logging uses different log types to allow users to easily filter on different types of information.
| Icon | Log type | Description |
|---|---|---|
 |
Debug | Consists of debug information for developers, e.g. log information about the deserialization of a Visio drawing. |
 |
Info | Consists of items that are logged by way of information, e.g. the connection URL, the save location of the saved users file, etc. |
 |
Connection | Consists of connection-related information, e.g. connection times in DataMiner Cube. |
 |
ClientSystem | Consists of information related to the client system, e.g. the processor, RAM, Windows version, .NET version, etc. |
 |
Freeze | Consists of information related to issues that cause the DataMiner Cube user interface to become unresponsive. These are detected by the Freeze Detection feature. E.g. a stack trace was logged because the dispatcher thread was suspended for longer than 10 seconds. |
 |
AgentInfo | Consists of information about the DMAs within the cluster that DataMiner Cube is connected to, e.g. in case the state of an Agent in the cluster changed to Running. |
 |
SPI | Consists of SPI information for developers, e.g. to enhance visibility and ensure proactive support. |
 |
Warning | Consists of information about issues that do not interfere with the functionality of Cube. Typically, this is used for input validation. It can for example mention if Cube is unable to validate a driver, or if something went wrong while reading/writing files or settings. |
 |
Error | Consists of information about issues in DataMiner Cube that interfere with normal functionality. In most cases, this is related to exceptions that cannot be properly handled, e.g. in case no appropriate settings could be discovered while connecting. |
 |
Exception | Consists of information about unhandled exceptions in Cube. There will always be a stack trace for this type of logging. |
Note
- By default, debug logging is not displayed. To display these log items, select the option Show debug logging at the top of the tab.
- By default, SPI logging is not displayed. To display these log items, select the option Show SPI logging at the top of the tab (Available from DataMiner 10.1.11/10.2.0 onwards).
- SPI logging is currently only supported in DataMiner Cube, if your system is connected to dataminer.services.
- When the Cube UI is not responsive, the Freeze Detection feature will cause a pop-up message to be displayed after a specific number of seconds of unresponsiveness. The time before this message is displayed depends on the Freeze time settings.