Troubleshooting: Where to start?
Suppose you see something is wrong with DataMiner, but you do not know where exactly the problem is… Where do you start the troubleshooting process? This article aims to provide some pointers on where you can start and how you can narrow down the possible causes of a problem.
Troubleshooting steps
Follow the steps below to detect the most high-level issues and collect basic data about the problem you discovered.
The steps go from more general, with a larger impact, to more specific. It is important to keep in mind that a general issue, such as a lack of disk space, must be resolved before more specific issues, such as DataMiner run-time errors, may be investigated.
Check the resource usage in Windows Task Manager
Open Windows Task Manager, go to the Performance tab, and check if CPU or Memory are at 98% or higher. All sorts of unintended behavior is possible when computing resources are unavailable. If this is the case, check the following:
Go to the Details tab, and enable the columns Working set (memory), Commit size and CPU time. You can do so via the right-click menu of the column headers (Select columns option).
Use sorting to find the processes with the highest CPU, CPU time, Commit size and Working set. If these are related to DataMiner, note which processes are involved and proceed to the next steps. These processes are not necessarily the root cause of the problem, but they may be closely related to the root cause.
The following processes are used by or related to DataMiner:
SL*.exe: The processes starting with SL (e.g. SLProtocol, SLElement) are the core DataMiner services.
DataMinerCube.exe: The DataMiner Cube desktop application.
PresentationHost.exe: The DataMiner Cube browser application.
mysqld.exe: The MySQL database, if applicable.
prunsrv.exe: The Cassandra database, if applicable.
elasticsearch-service-x64.exe: The Elasticsearch database, if applicable.
w3wp.exe: Windows Web Server, also known as IIS.
If the processes consuming the most resources are not related to DataMiner (e.g. antivirus, Windows updates, or a third-party application), resolve the issues outside of DataMiner before proceeding further.
Check if key DataMiner processes are running
Check if the following processes are running:
SLDataMiner.exe and SLNet.exe: These are the essential processes for DataMiner. If one of these is not running, the DMA is considered to also not be running. The steps below may help you identify the problem more accurately. You can also find more details on startup issues in the DataMiner Startup Issues flowchart.
SLLog.exe and SLWatchDog.exe: These processes are necessary for DataMiner self-monitoring and troubleshooting. If one of these is not running, information necessary for further investigation will not be available. Follow the DataMiner Startup Issues flowchart, and make sure these processes are running correctly before you investigate any further.
Check if there is enough disk space
If there is insufficient disk space on the system drive (i.e. C:) or on the drive used for the database, this can result in unintended behavior of the DataMiner Agent.
For normal operation, at least 15 GB of free space is required on the system and the database drive.
If there is insufficient disk space, free up disk space, reboot the server, and check if the issue is still present before investigating further. For more information, see Keeping a DMA from running out of disk space.
Check DataMiner CrashDump and MiniDump folders
Check if new files are present in the folder C:\Skyline DataMiner\logging\CrashDump. Files are created in this folder when an unexpected disappearance of a DataMiner process occurs.
Note the names of the processes if there are any. If a crash dump is saved correctly, you will have details on the exception that occurred in the ERRORLOG.TXT file inside the package.
Example:

Also check if new files are present in C:\Skyline DataMiner\logging\MiniDump. Files are created in this folder when a process disappearance or a run-time error is detected by the SLWatchDog process.
The minidump is a copy of all DataMiner log files saved at the moment a problem is detected by SLWatchDog. It should not be confused with a crash dump and a memory dump, which are snapshots of memory allocated by a certain process.
In case of a run-time error, the file name format is
<timestamp>_<process name>.zip. Note the name of the process and proceed to the next step.In case of a process disappearance, the file name format is
<timestamp>_Process disappeared.zip. You can find the name of the process in SLWatchdog2.txt inside the archive.
Example of minidump in case of process disappearance:
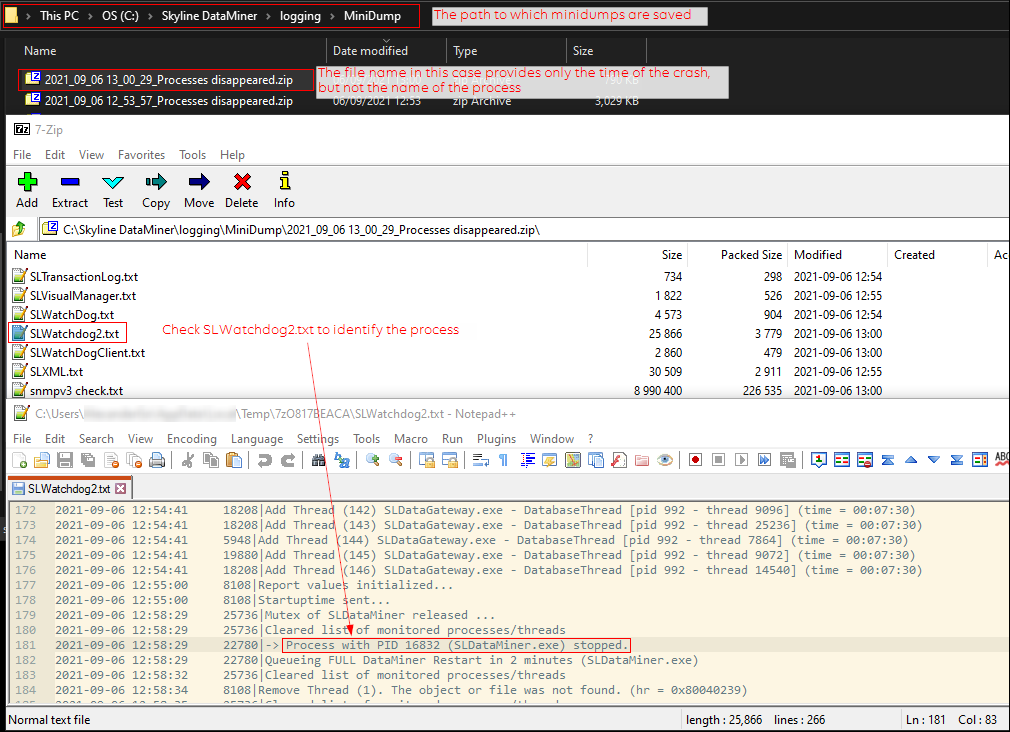
Check SLWatchdog2.txt for the initial problem
It is possible that more that one problem is occurring at the same time or that a major problem is caused by a less visible problem that occurred earlier. SLWatchdog2.txt can help you identify the initial problem.
Look for the following lines:
Not signaled 1 (since <timestamp>): <process name> … <thread name and ID>This line contains the exact timestamp of the moment when a thread stopped responding.
THREAD PROBLEM : <process name> - <thread name and ID>This line shows the moment when SLWatchdog reports a run-time error and saves a minidump. For most threads, this happens when a thread is not responding for 15 minutes.
Send alarm for process <process name> … (RTE Count = 1 )The RTE Count helps you identify the first run-time error if there are multiple thread problems at the same time.
CLEARED RTE: Runtime error cleared in process <process name> …In some cases, run-time errors do not cause major problems and clear themselves when an operation that occupies a thread is completed. When an RTE clears, the RTE count is reduced.
Process with PID <process ID> (<process name>) stopped.This line indicates an unexpected disappearance of a DataMiner process (i.e. a process crash).
Follow these steps to identify the initial problem in SLWatchdog2.txt based on these lines:
Look for the latest occurrence of the string “(RTE Count = 1 )”.
The thread that is not responding is indicated in the “THREAD PROBLEM” line above the “RTE Count = 1” string.
The moment when the thread stopped responding is indicated in the “Not signaled 1 (since
)” line logged for the respective process and thread.
Look for the earliest occurrence of the line “Process with PID … stopped”.
The earliest timestamp found in the two steps above (the first process disappearance or detection of an unresponsive process) is the likely time the problem occurred.
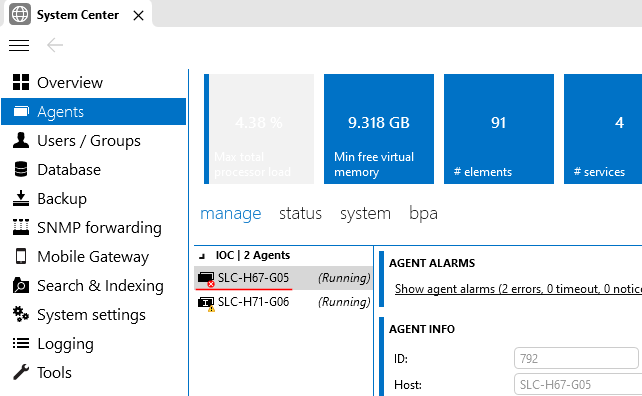
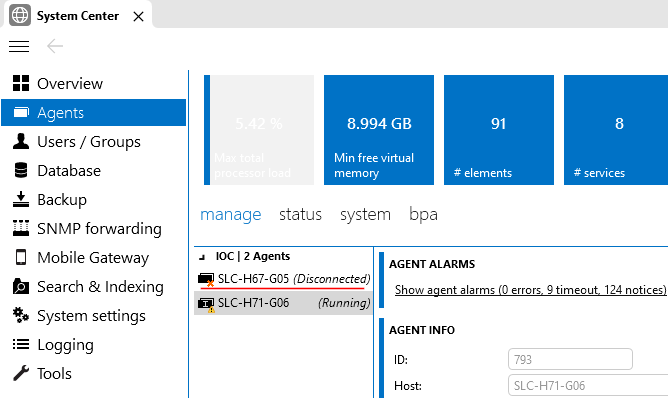
Identifying a DMA with a problem
If it is unclear which DataMiner Agent is having a problem, these checks may help you identify it:
In System Center, go to the Agents tab, and check for DataMiner Agents with RTE or Timeout icons:
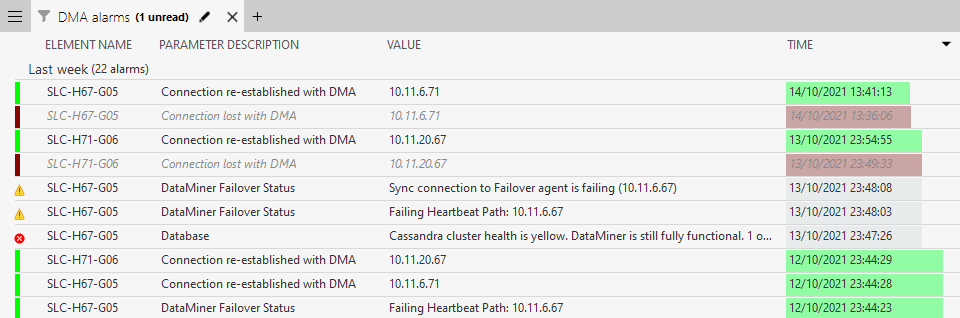
In the Alarm Console, add a filtered tab using the filter “Element type / Equal to / DataMiner Agent” to display DataMiner-related alarms.
In the example below, the displayed alarms can point to an issue on a specific Agent:
The problem may be related to a client connecting to a specific DataMiner Agent. To rule out the Agent used for client connections, try connecting to a different DMA and verify if the issue is still present.
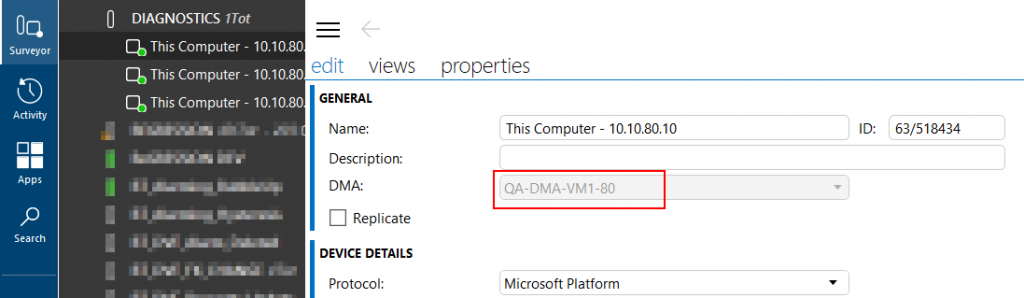
If a problem is related to a specific element or service, right-click and edit the object to see the hosting DMA of that object (indicated in the red box below):
Summary
With the steps above you can identify:
Which DataMiner Agent in a cluster is having a problem.
Whether the server itself is having a problem.
Whether a major DataMiner server-side problem is present.
Which DataMiner process is having a problem.
If you have found server-side issues, proceed to Troubleshooting – Critical Issues or Troubleshooting – Process Identification.
If you cannot find any issues with the steps above, proceed to Troubleshooting – Identify Per Module.