Using trend patterns to detect backup failures
This tutorial illustrates DataMiner's pattern matching feature in the context of Dashboards and Low-Code Apps. It will show you how to access patterns and occurrences within a dashboard and how to effectively handle missing pattern occurrences, using the example of server backups. By utilizing a trend pattern, DataMiner will detect the backups. The goal of the example dashboard in this tutorial is to generate a comprehensive report indicating whether daily backup patterns have been detected for all servers.
Estimated duration: 20 minutes.
Note
The content and screenshots for this tutorial were created in DataMiner 10.4.4.
Tip
- For more information, such as technical limitations of pattern matching, see Pattern matching.
- See also: Kata #41: Trend patterns in Cube - recap Empower and Kata #42: Trend patterns in Dashboards & LCA on DataMiner Dojo.
Prerequisites
- A DataMiner System connected to dataminer.services.
- DataMiner 10.4.4 or higher with Storage as a Service (STaaS) (recommended) or a self-managed Cassandra database with indexing.
- Pattern matching is enabled (in DataMiner Cube: System Center > System settings > analytics config).
Overview
The tutorial consists of the following steps:
- Step 1: Install the example package from the Catalog
- Step 2: Compile a list of the most recent backup pattern occurrences per server
- Step 3: Interpret the timestamp of every occurrence
Step 1: Install the example package from the Catalog
Go to https://catalog.dataminer.services/details/cc65fcf5-de87-4e3f-8209-fdd027928e56.
Deploy the Catalog item to your DataMiner Agent by clicking the Deploy button.
This will create a DataMiner element named Kata - Server overview in your system, which will be used throughout the rest of the tutorial. The element will be located in the view Kata > Trend patterns in Dashboards and LCA. This will also create a trend pattern and generate occurrences. This might take a couple of minutes.
In DataMiner Cube, check whether the element Kata - Server overview has been created before you continue to the next step.
Step 2: Compile a list of the most recent backup pattern occurrences per server
Drag and drop the Dropdown visualization from the pane on the left to the top of the dashboard.
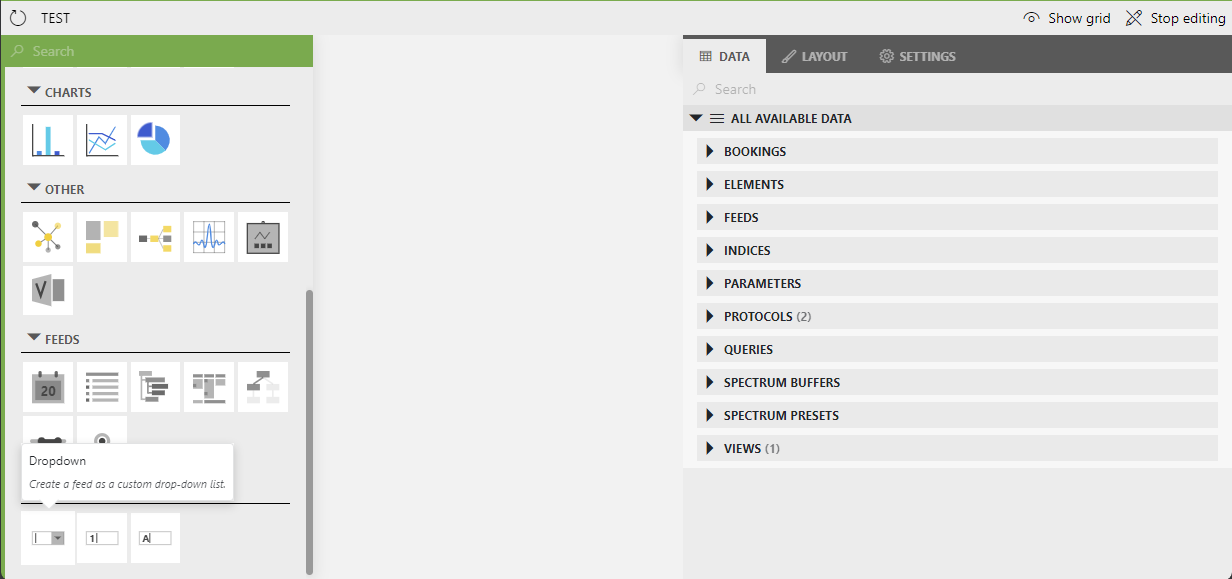
This component will allow users to select a specific trend pattern, which will be used in a query to retrieve the occurrences.
Drag and drop the table visualization from the pane on the left to the dashboard, below the dropdown component.
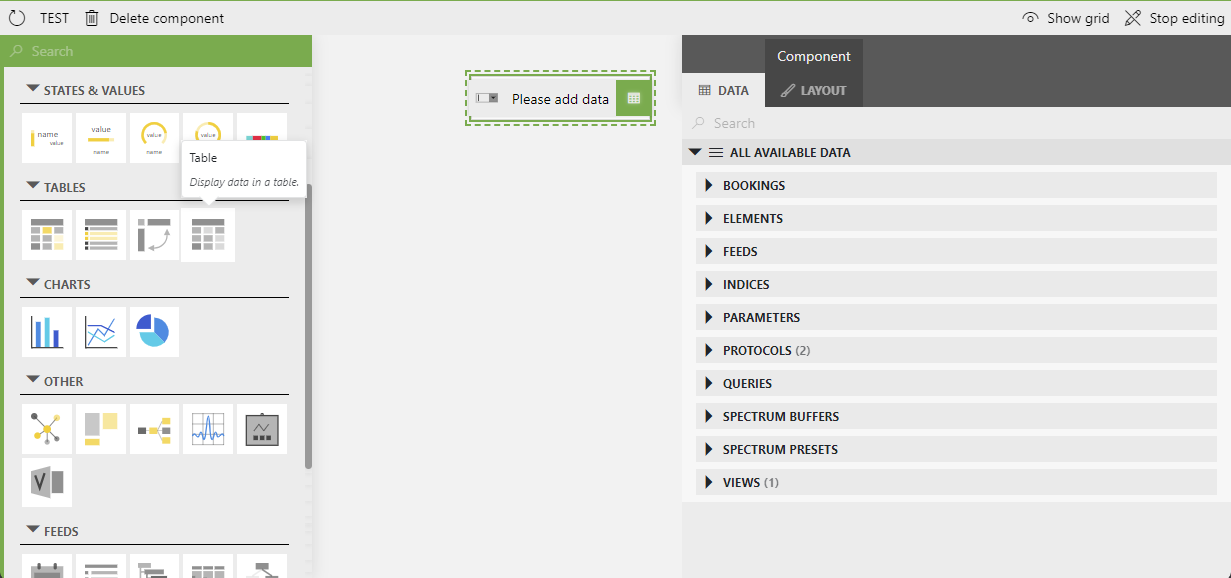
This will add a table component. In this component, you will show the output of a GQI query.
Drag the edges of the table component to resize it until it takes up the width of your screen.
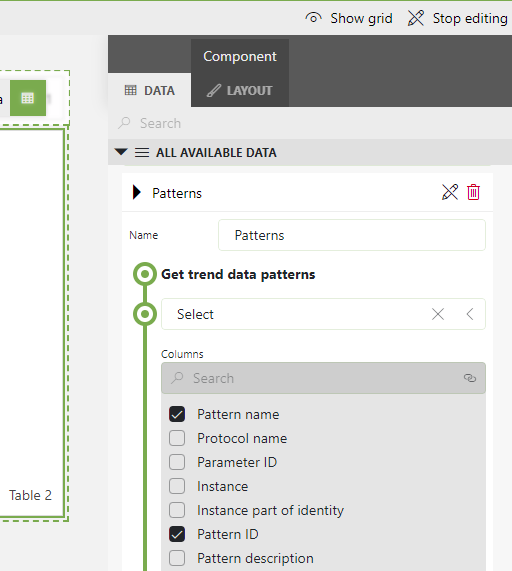
In the data pane, open the QUERIES section and click the "+" icon to create a new query.
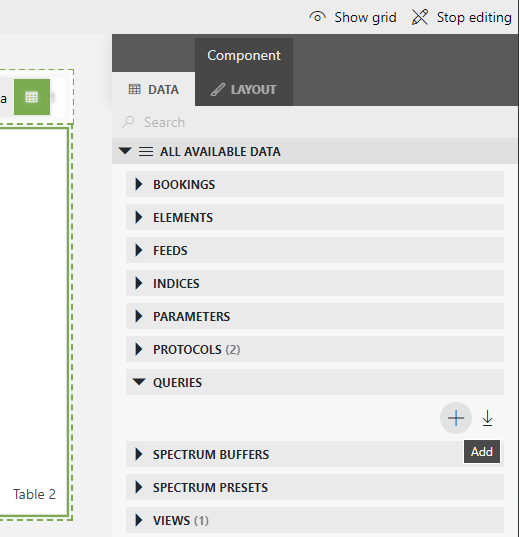
Name the new query
Patterns.Configure the query as follows:
Select the Get trend data patterns data source.
Add a Select operator and make sure to have both Pattern name and Pattern ID selected.
Drag the query to the dropdown component at the top of the dashboard.
This will link the component to the query, allowing the user to select any of the patterns in the system.
In the dropdown component, select the pattern Kata backup.
This pattern has been added by the package you installed earlier.
Create another query and name it
Most recent pattern occurrences per server.Drag the query to the table component in order to link the component to this query.
Configure the query as follows:
Select the Get trend data pattern events data source.
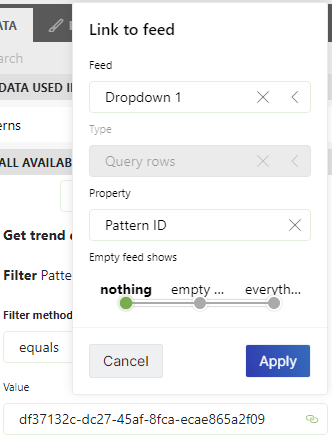
Add a Filter operator and configure it as follows:
Column: Pattern ID.
Filter method: Equals
Value: Click the link icon in the value box, then select your Dropdown feed and the property Pattern ID, and click Apply.
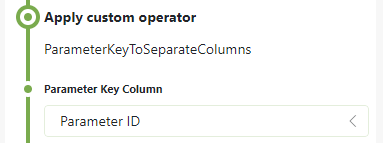
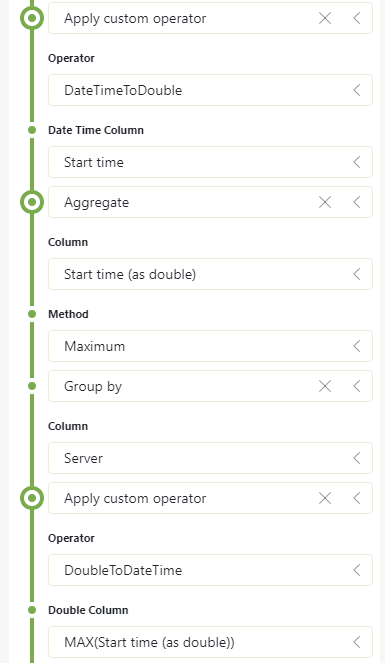
Add an operator to extract the server name from the table key, so you will be able to use this as a column name:
At the bottom of the query, select Apply custom operator, and then select ParameterKeyToSeparateColumns.
In the Parameter Key Column box, select Parameter ID.
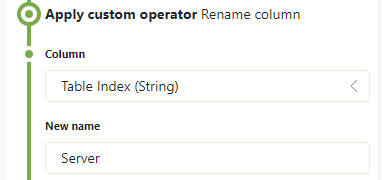
Add another custom operator to rename the Table Index column to Server.
Select Apply custom operator, and then select Rename column.
Select the column Table Index and specify the new name
Server.
Configure the query so that the most recent pattern occurrences per server will be retrieved:
Add another custom operator to transform the values from the Start time field from DateTime to double format:
Select Apply custom operator, and then select DateTimeToDouble.
Select the DateTime column Start time.
This transformation is necessary to be able to do an aggregate operation on the Start time column, as the Aggregate operator does not support DateTime columns yet.
Add an Aggregate operator to get the most recent pattern occurrence per server:
- Column: Start time (as double)
- Method: Maximum
Add a Group by operator, selecting the column Server.
Add the DoubleToDateTime custom operator to transform the result back to DateTime format.
Your query should now look like this:
Add another Rename column custom operator to rename the aggregated result column to
Most recent pattern occurrence.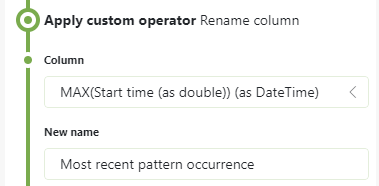
Step 3: Interpret the timestamp of every occurrence
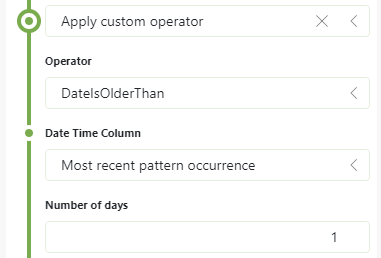
Now that you have retrieved the most recent pattern occurrence per server, you can use a custom operator to make a judgment based on those timestamps. A custom operator provides a lot of flexibility, allowing you to code pretty much whatever you want. In this case, the custom operator DateIsOlderThan will be used, which is available in the Catalog and was also included in the package you installed earlier. It adds a column indicating if the date is older than a given number of days.
At the bottom of the Most recent pattern occurrences per server query, add the DateIsOlderThan custom operator, with the following configuration:
- Date Time Column: Most recent pattern occurrence
- Number of days: 1
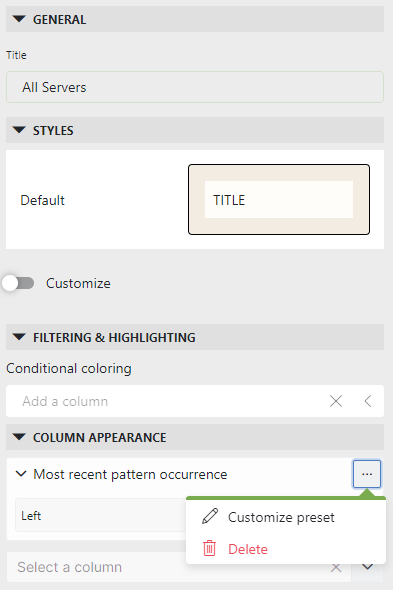
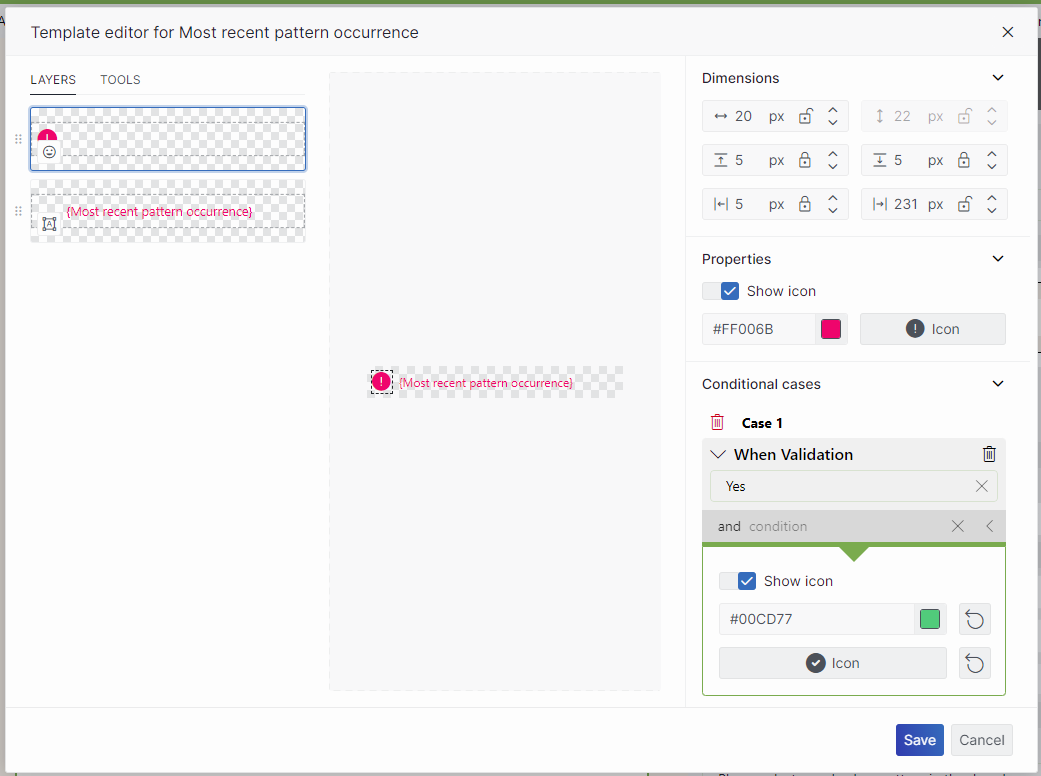
Use the Template editor to configure a validation icon/color for the Most recent pattern occurrence column:
Select the table, go to Layout > Column appearance, and select the Most recent pattern occurrence column.
Below this, select Left.
On the right side of box where you have selected the column, select ... > Customize preset to open the template editor.
In the template editor, go to the Tools tab, select Icon, and drag the mouse pointer on the left side of the work area to draw the icon layer.
While the icon is selected, you can use the Dimensions boxes on the right to resize and reposition it exactly the way you want.
Select the text layer, and adjust the right margin via the lower-left Dimensions box on the right, so that the text is displayed next to the icon.
Add a condition to the icon layer for when the validation is OK:
Click + Add case.
Click When condition, select Validation, and specify the filter
Yes.Select Show icon, set the color to green (e.g., #85A864) and the icon to a check mark.
When you select the icon, you can use the filter box to quickly find a specific icon.
Add another condition to the icon layer for when the validation returns invalid:
Click + Add case.
Click When condition, select Validation, and specify the filter
No.Select Show icon, set the color to red (e.g., #FF0000) and the icon to an "error" exclamation mark.
Similarly, add conditions to the text layer that will turn the text color to green or red depending on the validation.
Tip
See also: Template editor.
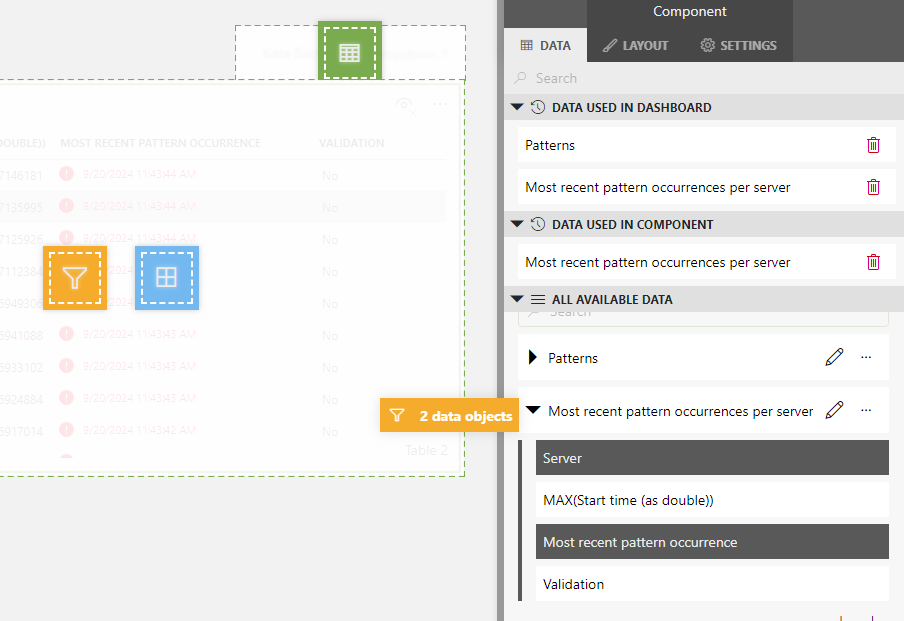
Hide the columns in the table that no longer need to be shown:
In the data pane, make sure you are no longer editing the Most recent pattern occurrences query, and expand the query so you can see the columns it contains.
Drag and drop the columns Server and Most recent pattern occurrence to the table component, so that these are added as a filter.
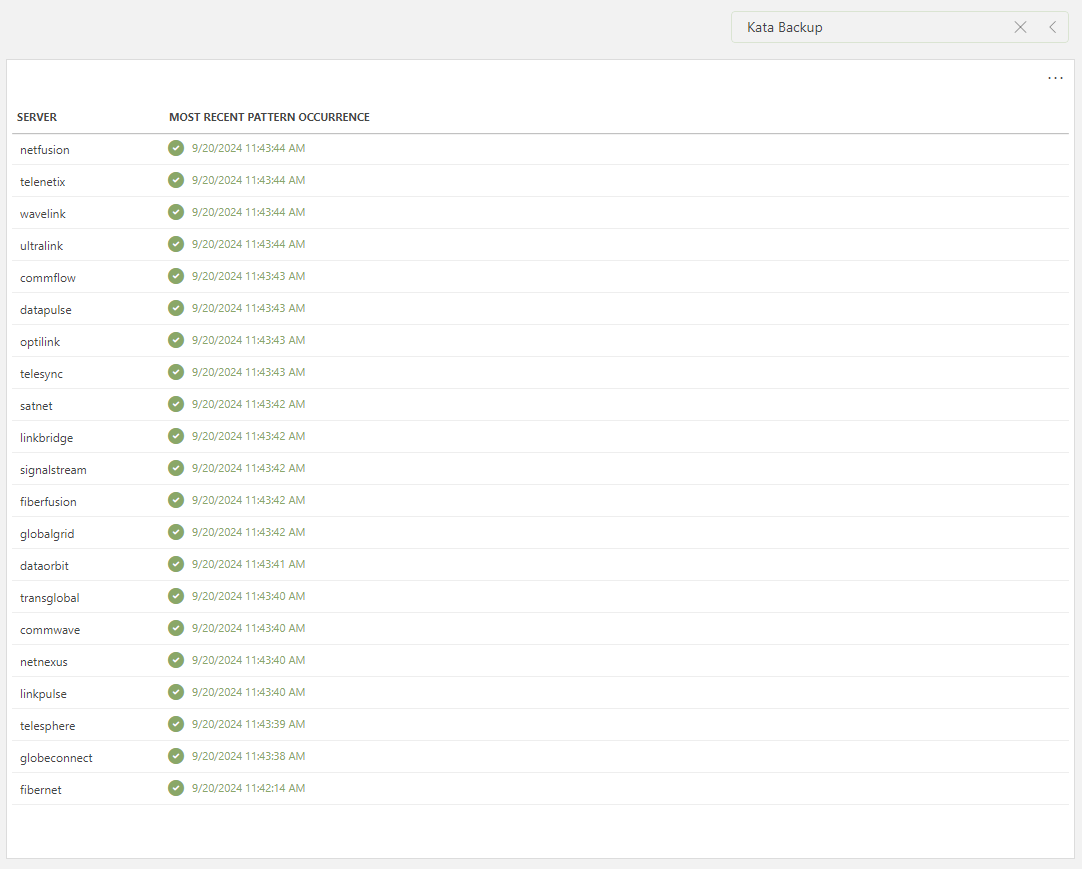
The resulting dashboard could for instance look like this: