Creating an alarm dashboard for a daily DMS health check
In this tutorial, you will learn how to create an alarm report dashboard that will provide a user-friendly overview of everything you need for your daily DMS health check. The tutorial will also dive into the Alarm Filtering app, which is a great tool to tackle even the worst alarm storms with a clear overview.
Expected duration: 20 minutes
Note
The content and screenshots for this tutorial have been created with the DataMiner 10.4.12 web apps.
Tip
See also: Kata #52: Alarm Dashboards for your daily DMS Health Check on DataMiner Dojo 
Prerequisites
- A DataMiner System that is connected to dataminer.services.
- Version 10.3.5 or higher of the DataMiner web apps.
Overview
- Step 1: Install the Alarm Report package
- Step 2: Install the Alarm Filtering app
- Step 3: Install the Animal Shelter package (optional)
- Step 4: Adapt the Alarm Report dashboard to filter on views
- Step 5: Create a custom alarm template for the Animal Shelter protocol (optional)
- Step 6: Take ownership of an alarm
- Step 7: Add a new customized page to the Alarms Filtering app
Step 1: Install the Alarm Report package
Go to https://catalog.dataminer.services/details/5d795a13-814e-4ece-91da-049c3e8e9f38.
Click the Deploy button to deploy the Alarm Report package on your DMA.
When the package has been deployed, open the Dashboards app and check if you can see the Alarm Report dashboard.
When the deployment is complete, this dashboard is added in the root view of your dashboards folder structure.
Optionally, move the dashboard to another folder:
Right-click the dashboard in the pane on the left and select Settings in the context menu.
Specify a new location and click Apply.
Tip
For more detailed information, see Moving a dashboard to a different folder
Step 2: Install the Alarm Filtering app
Go to https://catalog.dataminer.services/details/9794badc-d191-4f36-9b96-08c415e620a4.
Click the Deploy button to deploy the Alarm Filtering App package on your DMA.
Go to the root page of your DataMiner System, for example by clicking the Home button for your DMS on the dataminer.services page.
Check if you can see the Alarm Filtering app listed under Other Apps.
Step 3: Install the Animal Shelter package (optional)
To get to a good starting point for the rest of this tutorial, you ideally need a DataMiner System with a history of multiple alarms. If you already have an existing system available with multiple elements and views, you could use this for this tutorial, which means that you can skip this step in that case.
However, if you are for example using a brand-new DaaS system, you will need to install a package that helps you create this starting point. You can use the Animal Shelter package for this, which is a Learning & Sample Solution designed specifically for this type of use case.
Go to https://catalog.dataminer.services/details/e3e335a6-76c3-4254-90cb-3b2335300b0f.
Click the Deploy button to deploy the Animal Shelter package on your DMA.
Six elements will be created on the DMA, as mentioned in the description of the Catalog package.
If you are installing this package on a brand-new DaaS system, restart DataMiner to make sure the historical alarms are loaded correctly: In DataMiner Cube, go to System Center > Agents, and click the (Re)start button.
Important
Only restart DataMiner if you are using a brand-new DaaS system. In other cases, do not restart DataMiner, as this could affect other ongoing operations on your DataMiner System. For detailed information, refer to the deployment details in the Technical Reference section of the package description.
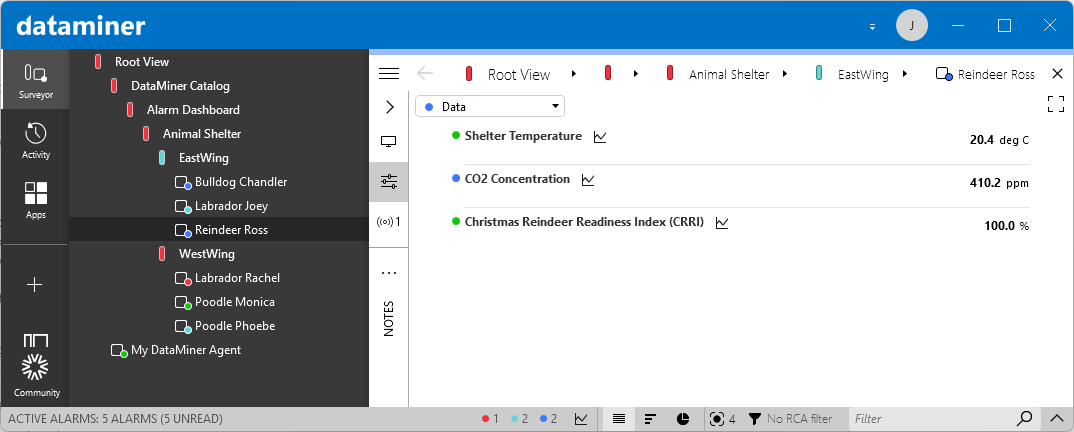
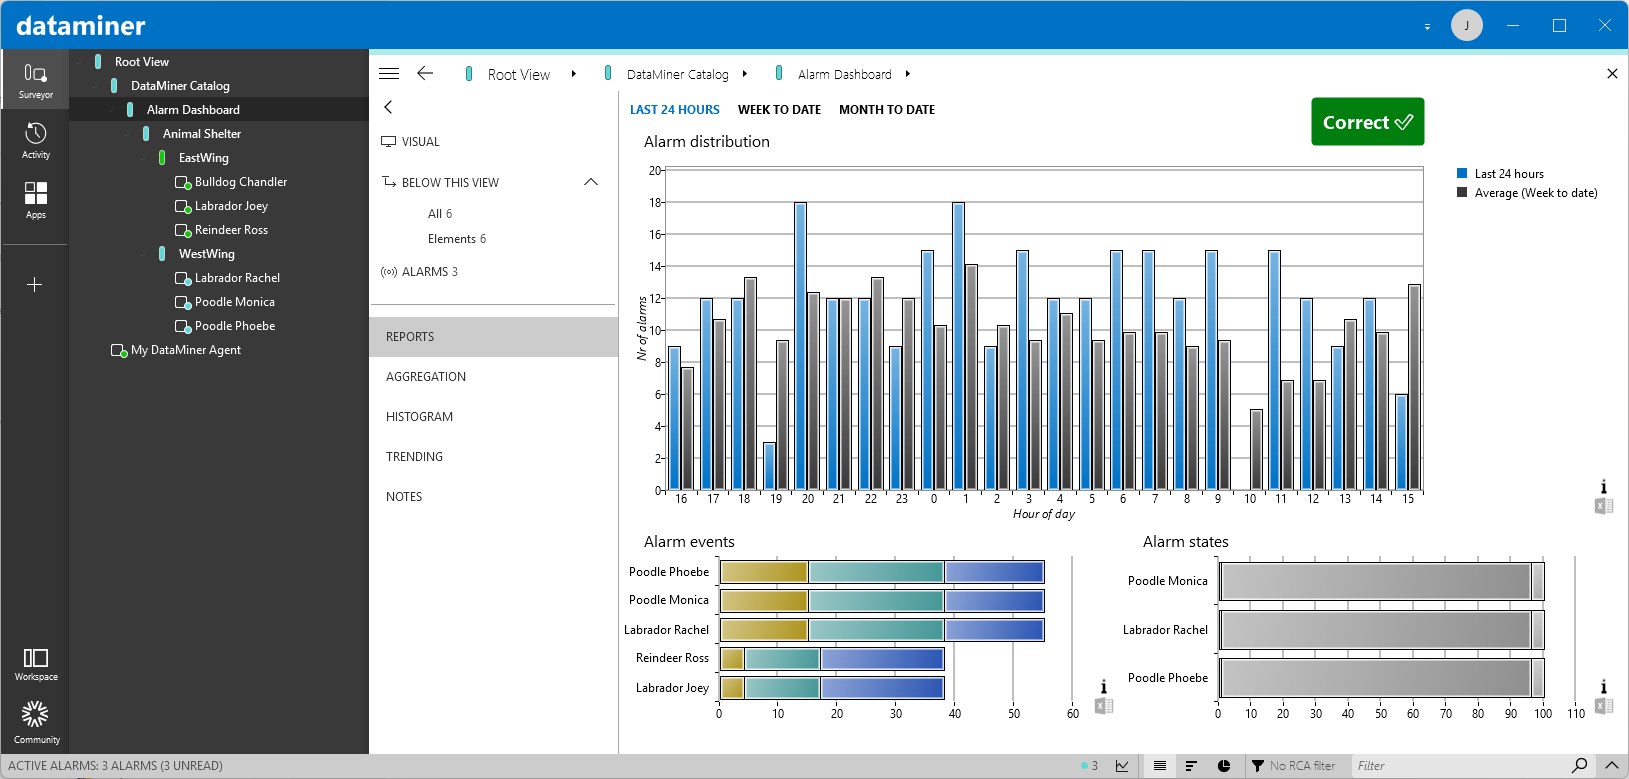
In DataMiner Cube, navigate to the DataMiner Catalog > Alarm Dashboard view, and select the REPORTS page.
When everything is loaded correctly, the alarm distribution will look like this:
Step 4: Adapt the Alarm Report dashboard to filter on views
Go to the Dashboards app, and open the Alarm Report dashboard.
In the upper-right corner, click Start editing.
Add a dropdown component where users will be able to select a view in the DataMiner System:
Drag and drop the edge of the components to create free space in the upper-right corner of the dashboard.
In the Data pane on the right, select the Views data source and drag it to the empty space on your dashboard.
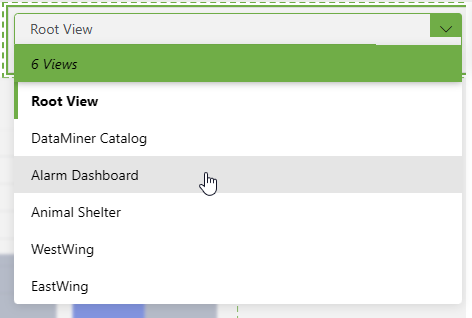
in the component, click Pick a visualization, and then select the Dropdown visualization.
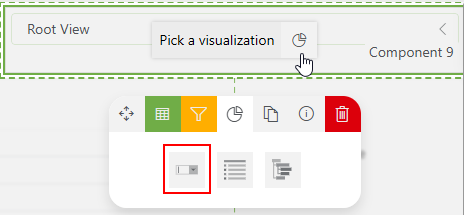
This should result in a dropdown box where all views are available for selection:
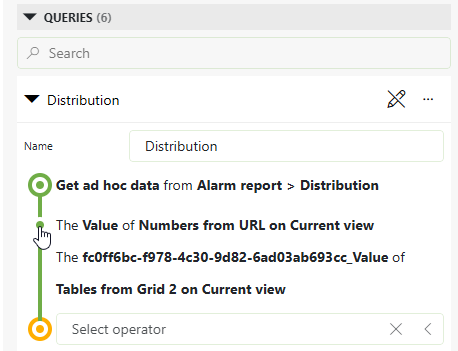
Link the Distribution query in the dashboard to the dropdown component for its view filter:
- In the Data pane on the right, expand the Queries node and click the pencil icon next to the Distribution query.
1.Click the dot next to the second item in the query to view its detailed configuration:
Click the link icon next to the input field of the view filter.
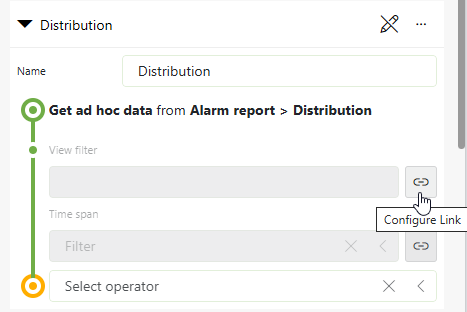
In the Data box, select the dropdown component you have just created (Dropdown 14 in the example below, but the number in your dashboard can be different).
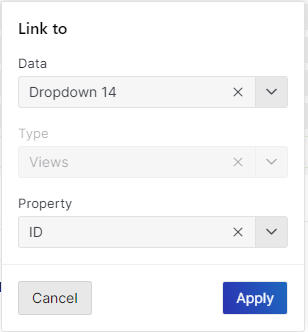
In case the dropdown is not among the available options you can select, close and reopen the Dashboards app to reload the UI.
The Property box, select ID.
This way, the view ID will be passed to the ad hoc data source, which will lead to the wanted result.
Also link the Alarm Events and States queries to the dropdown component for their view filter, in the same way as detailed above.
The dashboard will now give you an overview of the alarm distribution and the main alarms for the selected view (similar to the Reports page from the previous step), so that you can easily check the health of your DMS. You can also share the dashboard with other users as a static report by email or via dataminer.services.
Step 5: Create a custom alarm template for the Animal Shelter protocol (optional)
In the next step, you will need to be able to take ownership of an alarm. If you have installed the Animal Shelter package to have alarms in your system, you will first need to fine-tune the alarm template so that an active alarm will be created:
In DataMiner Cube, open the Protocols & Templates module.
In the Protocols column, select Skyline Animal Shelter.
in the Versions column, select 1.0.0.1.
Right-click the Default3 alarm template and select Duplicate.
Specify the name
Default3 - Labradorsand click OK.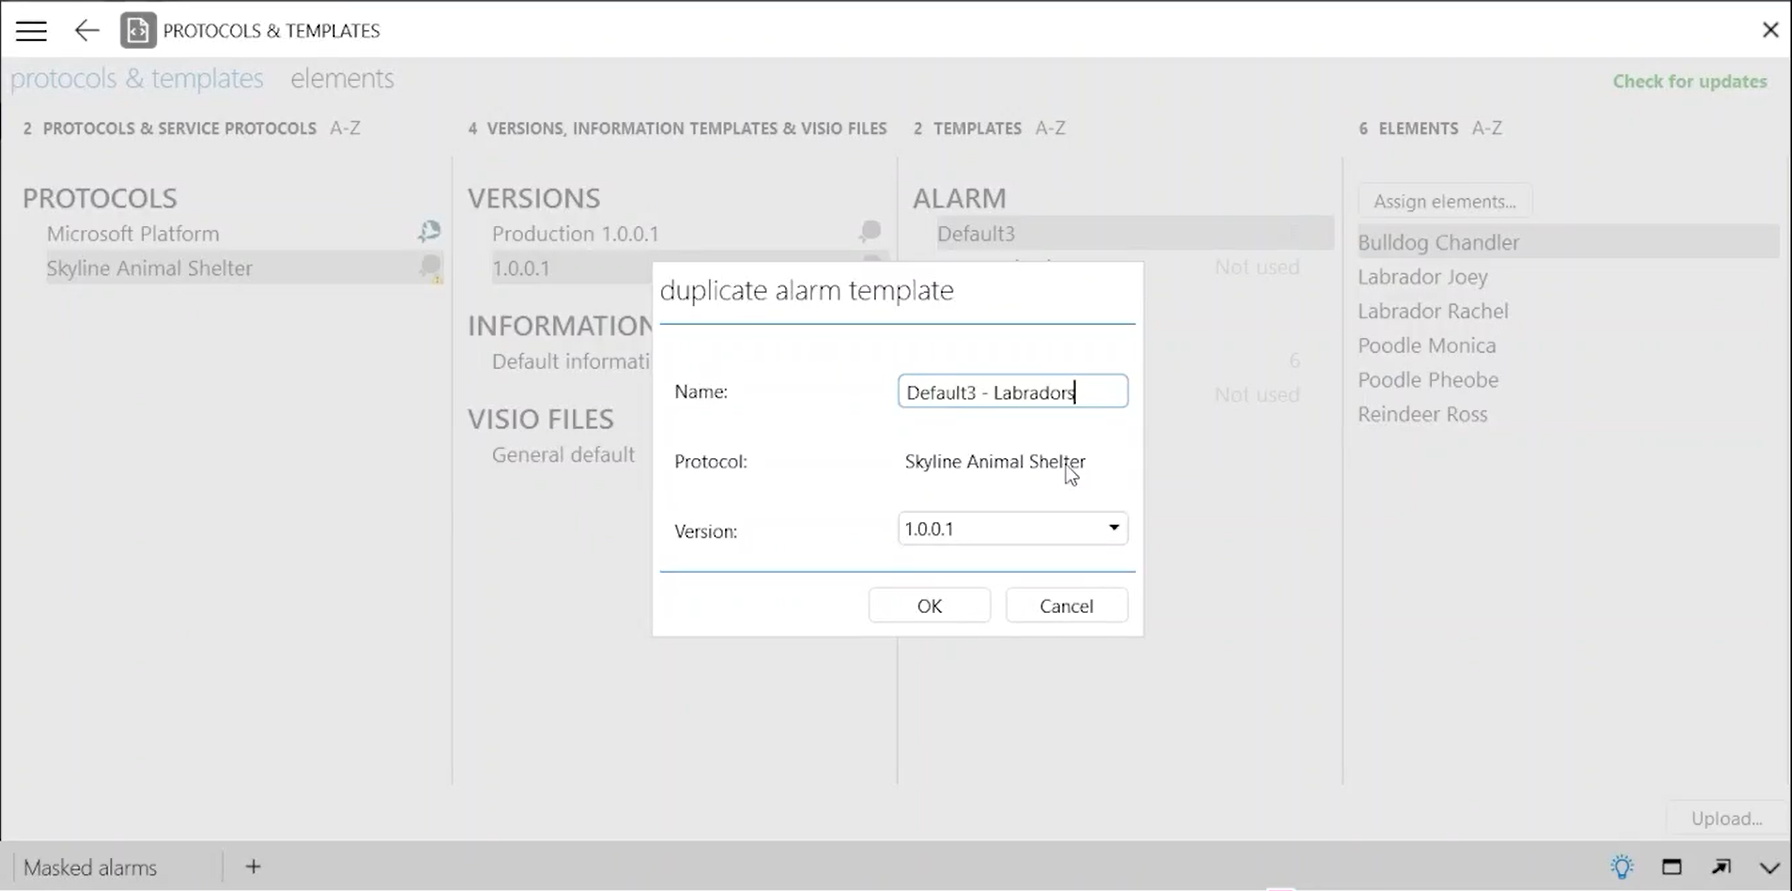
Double-click the duplicated alarm template to open it.
Configure the alarm thresholds for the Shelter Temperature parameter as indicated below.
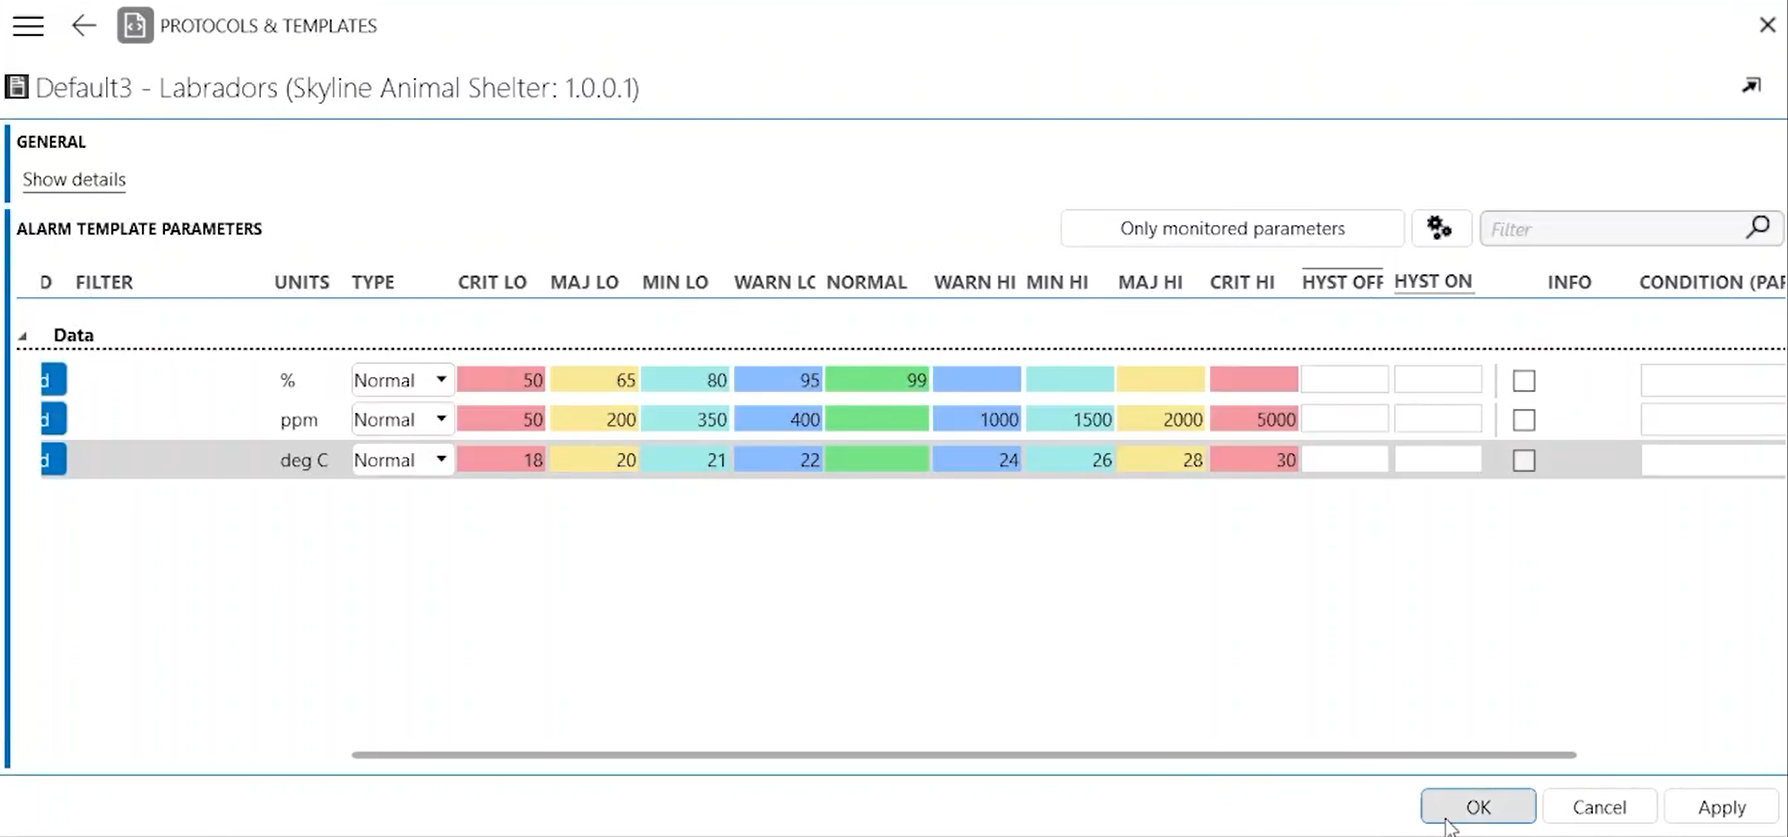
This will make the alarm thresholds more strict, so that it is more likely that an alarm will be triggered.
Click OK to apply and close the window.
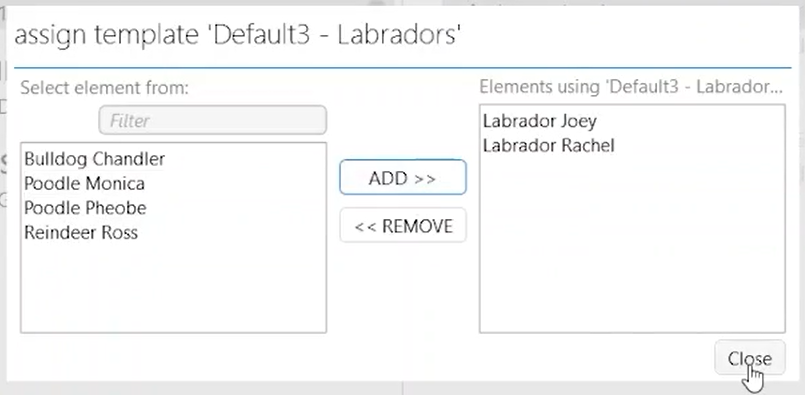
In the Elements column, click the Assign Elements button, assign the newly created alarm template to the Labrador elements, and click Close.
Step 6: Take ownership of an alarm
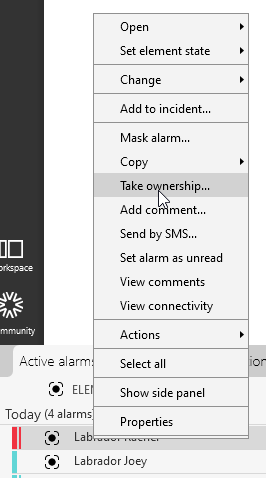
In the Alarm Console in DataMiner Cube, open the tab Active Alarms.
Right-click an alarm and select Take ownership
This can for example be an alarm for a Labrador element that you forced by assigning the custom alarm template in the previous step.
In the message box, write a message (for example,
We will open a window.for the Shelter Temperature alarm).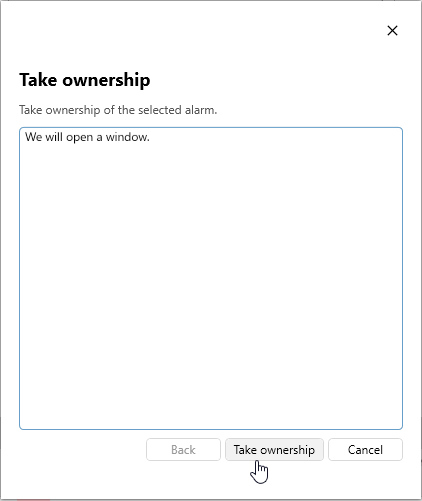
Click Take ownership to close the dialog.
Step 7: Add a new customized page to the Alarms Filtering app
Open the Alarm Filtering app that you installed in step 2.
Click the pencil icon in the upper-right corner to start editing the app.
Click the + icon in the bar all the way on the left to add a new page, and name it
My Alarm Overview.In the Data pane on the right, expand the Queries node and click the + icon to add a query.
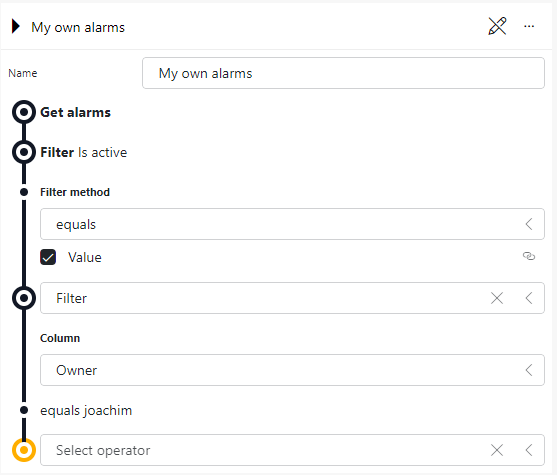
Configure the new query as follows:
Enter the name
My own alarms.Add the data source Get alarms.
Add a Filter operator.
Configure the filter with the column Is Active and select the Value checkbox.
This way, the filter will be applied for alarms for which the Is Active property is equal to true.
Add another Filter operator.
Configure the second filter with the column Owner, filter method equals, and your username as the value.
In the example below, the username is joachim.
Click the pencil icon next to the query name to stop editing the query.
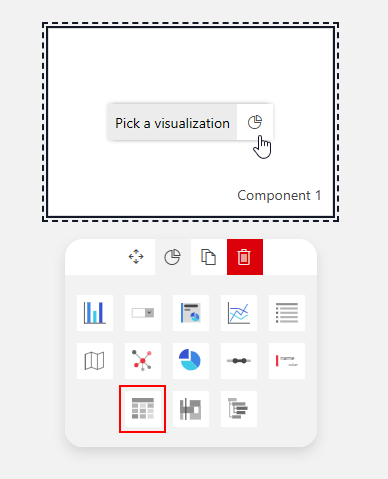
Drag the query onto the page.
Click Pick a visualization and select the Table visualization.
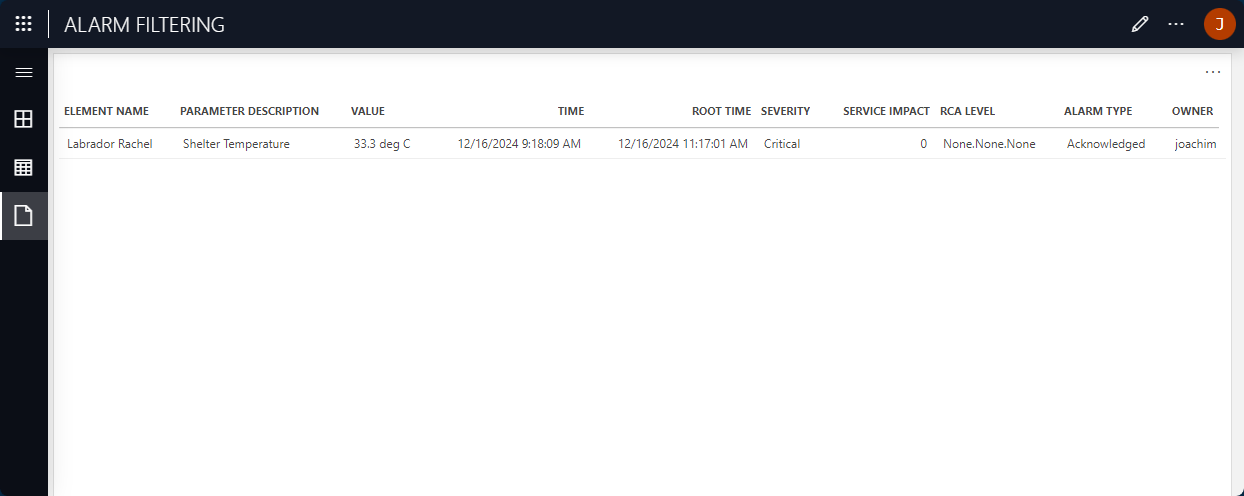
Take a look at the end result:
The table should now list any alarms that you have taken ownership of, including the alarm from the previous step.
This is just one of the possible changes you can do to the Alarm Filtering app in order to get a custom filtered overview of the alarms in your system. Check out the other tutorials related to Dashboards and Low-Code Apps to get inspiration as to how you can further customize this app to your needs.