Spectrum analyzer
You can use this component to display a spectrum graph.
Spectrum analyzer component in DataMiner 10.6.7
Supported data types
A spectrum analyzer component should always be configured with spectrum element data or spectrum buffer data. You can either directly configure a specific element or buffer or link the component to another component (e.g., a dropdown) that allows users to select the data source.
To add a spectrum buffer to a component, you can either add an individual spectrum buffer, or add the spectrum buffers group and then add a spectrum element filter.
Working with spectrum presets
Optionally, you can add a spectrum preset as a filter:
If a preset is specified, the visualization will use that preset.
If no preset filter is specified, the component will display the graph for the most recently closed spectrum session of the current user for the selected spectrum element.
Tip
- You can let the user select the spectrum preset by adding a dropdown component as a data source for the spectrum analyzer component. Use the Spectrum presets group as a data source for the component and then add a protocol filter to configure it.
- If a spectrum analyzer component uses spectrum buffer data, it is possible to color the threshold lines from the preset based on the state of a spectrum monitor parameter. For this purpose, the spectrum monitor must use a script containing variables that refer to the threshold lines. Each threshold line has a threshold ID, which is an index ranging from 1 to the total number of thresholds in the preset. To refer to the first threshold, the script variable should be $threshold1, for the second threshold, it should be $threshold2, etc. This format is case-sensitive. When you configure the spectrum monitor parameters, you can then select these variables to create a parameter with alarm monitoring (see Configuring spectrum monitors).
Switching between measurement points
You can allow users to visualize and switch between measurement points for a spectrum session by combining components:
Add a spectrum analyzer component and use a spectrum analyzer element as its data input.
Optionally, add a spectrum preset filter.
Add a list component.
In the Data pane, go to All available data > Components > [Page/Panel name] > Spectrum analyzer > Selection and drag Spectrum sessions onto the list component.
Note that depending on your setup, the exact path may be different. For example, in versions prior to DataMiner web [CU21]/10.3.0 [CU9]/10.4.12, component data is found under the Feeds data category.
A list of all the available measurement points will be shown, with a colored LED. This LED will be a filled circle for the active measurement point and an empty circle for other measurement points. If measurement points are selected in the list, this will update the spectrum session, so that the spectrum analyzer visualization shows those measurement points.
Optionally, enable filtering of the list by name (supported from DataMiner web 10.5.0 [CU16]/10.6.0 [CU4]/10.6.7 onwards):
Add a a search input component (or a different component that outputs a string value).
In the Data pane, go to All available data > Components > [Page/Panel name] > Search input > Value and drag Texts onto the list component.
This links the input value to the list, allowing users to filter the displayed spectrum sessions based on the entered text.
Configuration options
Spectrum analyzer layout
In the Layout pane, you can find the default options available for all components. See Customizing the component layout.
Additionally, from DataMiner web 10.5.0 [CU16]/10.6.0 [CU4]/10.6.7 onwards, the Theme source option is available. This option determines how colors are applied in the spectrum analyzer component. This option can be set to either Preset or Custom:
Preset (default): The displayed trace colors and grid colors depend on the preset. The same goes for the background color and text color of the spectrum graph, and for the show/hide settings for the grid and for axis labels.
Custom: Trace, threshold, minimum, maximum, and average colors are inherited from the theme settings and can be customized by specifying the color in RGB format, by entering the hex value or HTML color name, or by using the color picker box. Background, font, axis, and grid colors are inherited from the component theme.
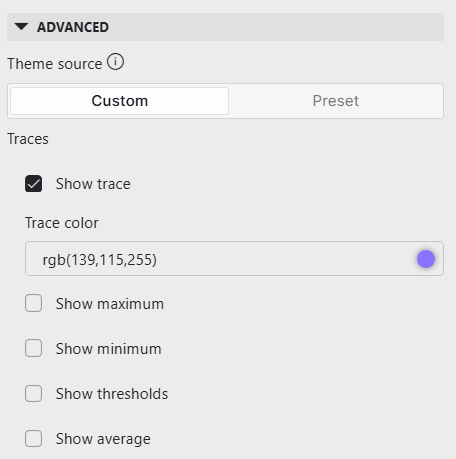
Advanced spectrum analyzer layout options in DataMiner 10.6.7
Spectrum analyzer settings
In the Settings pane, you can configure whether the component inherits the WebSocket settings from the page or panel. If you disable this option, you can define a custom polling interval for the component (in seconds).