Ping Monitoring UI overview
The Ping Monitoring tool UI consists of the following main components:
Header bar (1)
Sidebar (2)
Overview pane (3)

The Ping Monitoring header bar
You can find the following functionalities in the header bar of the application:
On the Destinations page:
Refresh: Allows you to reload the data on the page.
Add destination: Allows you to add a new destination.
Edit: Allows you to edit the selected destination.
Delete: Allows you to delete the selected destination.
On the Grid View page:
- Refresh: Allows you to reload the data on the page.
On the Groups page:
Refresh: Allows you to reload the data on the page.
Create group: Allows you to create a new group.
Edit: Allows you to edit the selected group.
Delete: Allows you to delete the selected group.
On the Alarms page:
- Alarm History: Allows you to access all alarms that occurred in the last 15 minutes, hour, 3 hours, 12 hours or 24 hours.
The Ping Monitoring sidebar
The sidebar on the left of the Ping Monitoring tool contains buttons that can be used to access different pages:
 : Clicking the Destinations button displays a list overview of all available destinations in your DataMiner System, along with all available information. See The Destinations page.
 : Clicking the Grid View button displays a grid overview of all available destinations in your DataMiner System. See The Grid View page.
 : Clicking the Groups button displays an overview of all active groups in your DataMiner System. Each group corresponds to a Generic Ping element. See The Groups page.
 : Clicking the Alarms button displays an overview of all active alarms in the groups. See The Alarms page.
The Ping Monitoring overview pane
The 'Destinations' page
The Destinations page offers an overview of all IP addresses in your DataMiner System receiving ping commands on a predefined, customized basis.
The following information is available for each destination:
Destination address: The URL or IP address of an internet destination, e.g., www.skyline.be.
Description: A brief description provided to the destination, e.g., Skyline.
Group: The group the destination belongs to, corresponding to a Generic Ping element, e.g., Websites.
Admin status: The status (enabled or disabled) of the destination.
Ping result: The time it took each destination to reply to the last ping command, e.g., 4 ms.
Cycle packet loss: The percentage of lost packets during ping command and response process, e.g., 0.00 %.
Clicking the  button displays additional information about the destination, including host information, results, settings, and more.
With the buttons at the top of the page, you can create, edit, and delete destinations.
The 'Grid View' page
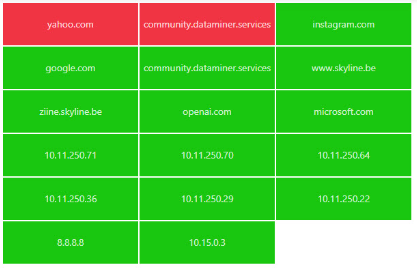
The Grid View page offers a compact grid overview of all destinations, ideal for managing a large number of destinations. The color of each grid tile indicates the associated destination's alarm severity level.

Click any tile in the grid to display additional information about the destination, including host information, results, settings, and more.
The 'Groups' page
The Groups page offers an overview of all active groups, with each group corresponding to a Generic Ping element in your DataMiner System.
This is the main information that is available for each group:
# Dst enabled: The number of enabled destinations in the group.
# Dst disabled: The number of disabled destinations in the group.
Current responding ping: The percentage of destinations responding to ping commands, e.g., 100.00 %.
Average ping time: The average time it takes for destinations within the group to receive and respond to a ping command, e.g., 11.46 ms.
Selecting a group in the overview will display all destinations configured within that group in the Destinations in Selected Group pane.

Clicking the Slowest Destinations in Group button will display any outliers in the groups, i.e., destinations that take a longer time than average to receive and respond to a ping command.
With the buttons at the top of the page, you can create, edit, and delete groups.
The 'Alarms' page
The Alarms page offers an overview of all active alarms in the groups. A filter pane on the left allows you to filter by group.
The filter pane
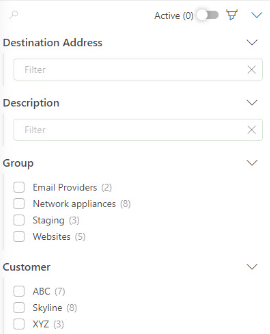
On the Destinations and Grid View pages, a filter pane on the left enables you to narrow down destinations based on their properties.

To limit the filter pane to an overview of the currently active filters, enable the toggle button in the top-right corner. Disable the toggle button to return to the full view.
In the lower-left corner, you can see the total destinations as well as the destinations that are currently active in your DataMiner System. Also, a progress bar above those destinations will count down to the next page refresh.