Installing Elasticsearch on a separate Linux machine
Important
Elasticsearch is only supported up to version 6.8, which is no longer supported by Elastic. We therefore recommend that you either use Storage as a Service instead or use OpenSearch.
If you use self-managed DataMiner storage instead of the recommended Storage as a Service (STaaS) setup, and you want to use an Elasticsearch cluster for your DMS, you can install Elasticsearch on a Linux machine as detailed below.
Note
We promote the use of Ubuntu LTS as the preferred Linux distribution. As such, the commands mentioned below will work on any Debian-based system, including Ubuntu.
Tip
- For more information about installing Elasticsearch, refer to the Elasticsearch Guide.
- If you encounter issues with Elasticsearch nodes, you can increase the log level for better diagnostics. See Logging.
Install the Elasticsearch software (version 6.8) on the Linux machine as described under Installing Elasticsearch with Debian Package in the official Elasticsearch documentation.
Make sure the firewall ports are open for Elasticsearch. Elasticsearch operates on TCP port 9200 and TCP port 9300.
There is a default firewall on Linux, but this is disabled by default. To enable the firewall, use the following command:
$ sudo ufw allow 22/tcp && sudo ufw enableImportant
The first part of the command above ensures that the TCP port 22 used for SSH connections remains open when the firewall is enabled. Enabling the firewall without defining the rule for incoming SSH connections may result in loss of connectivity to the server.
To add the correct ports to the firewall, you can for example use the following commands:
Commands node 1:
$ sudo ufw allow from [IP node 2] to [IP node 1] proto tcp port 9200,9300$ sudo ufw allow from [IP node 3] to [IP node 1] proto tcp port 9200,9300Commands node 2:
$ sudo ufw allow from [IP node 1] to [IP node 2] proto tcp port 9200,9300$ sudo ufw allow from [IP node 3] to [IP node 2] proto tcp port 9200,9300Commands node 3:
$ sudo ufw allow from [IP node 1] to [IP node 3] proto tcp port 9200,9300$ sudo ufw allow from [IP node 2] to [IP node 3] proto tcp port 9200,9300
Make sure all DMAs in the DMS can connect to port 9200 and 9300:
Commands DMA 1:
$ sudo ufw allow from [IP node DMA 1] to [IP node 1] proto tcp port 9200,9300$ sudo ufw allow from [IP node DMA 1] to [IP node 2] proto tcp port 9200,9300$ sudo ufw allow from [IP node DMA 1] to [IP node 3] proto tcp port 9200,9300Commands DMA 2:
$ sudo ufw allow from [IP node DMA 2] to [IP node 1] proto tcp port 9200,9300$ sudo ufw allow from [IP node DMA 2] to [IP node 2] proto tcp port 9200,9300$ sudo ufw allow from [IP node DMA 2] to [IP node 3] proto tcp port 9200,9300And so on.
Important
These commands could be different depending on the Linux distribution you are using. Refer to the official Elastic page on installing Elasticsearch for detailed information.
Mount the data folder to the data disk.
Note
- The folder where the Elasticsearch data is stored is configured in elasticsearch.yaml, in the property path.data.
- To verify on which disk the data is mounted, execute the "df" command.
Configure the user rights for the Elasticsearch user/group in the data folder.
You can do this with the following command:
$ sudo chown -R elasticsearch:elasticsearch /directoryname_from_path.dataConfigure the elasticsearch.yml files.
Make sure the Elasticsearch service is stopped. To stop the Elasticsearch service, use the following command:
$ sudo systemctl stop elasticsearch.serviceTo change elasticsearch.yml files, you can for instance use the following command:
$ vi /etc/elasticsearch/elasticsearch.ymlTip
For more information about vi editor, see What is vi.
Make the following adjustments in the elasticsearch.yml file based on your setup:
cluster.name: This needs to be the same for all nodes in your Elasticsearch cluster.
node.name: The name of the Elasticsearch node.
path.data: The location(s) where you want to store the data.
path.repo: The location(s) where you want to store the snapshots.
Tip
For information about taking and restoring snapshots, see Taking and restoring snapshots.
bootstrap.memory_lock: Set this to true.
network.host: The IP address of the node.
http.port: Set this to 9200.
discovery.zen.ping.unicast.hosts: The IP addresses of all the nodes in your Elasticsearch cluster. Elasticsearch nodes use this list of hosts to find each other and learn the topology of the ring.
Note
- We recommend a cluster of minimum three nodes, preferably in different racks.
- To add a node to an existing cluster, see Adding an Elasticsearch cluster node.
discovery.zen.minimum_master_nodes: see Configuring the master nodes.
gateway.recover_after_nodes: See Configuring the master nodes.
node.master: See Configuring the master nodes.
Make the following adjustments in /etc/default/elasticsearch:
MAX_LOCKED_MEMORY: Set this to unlimited.
JAVA_HOME: Set this to the custom Java path to be used for Elasticsearch, e.g. java-11-openjdk-11.0.14.0.9-1.el7_9.x86_64.
Make the following adjustment in /usr/lib/systemd/system/elasticsearch.service:
- LimitMEMLOCK: Set this to infinity. This must be set under the Service tag.
Set the maximum Java Heap Size under /etc/elasticsearch/jvm.options. For more information, see Setting the heap size.
Note
Elasticsearch can use quite a bit of memory. At least 8 GB of heap size should be specified. More could be required depending your system.
Start Elasticsearch and evaluate if the service is up and running.
To start Elasticsearch, use the following command:
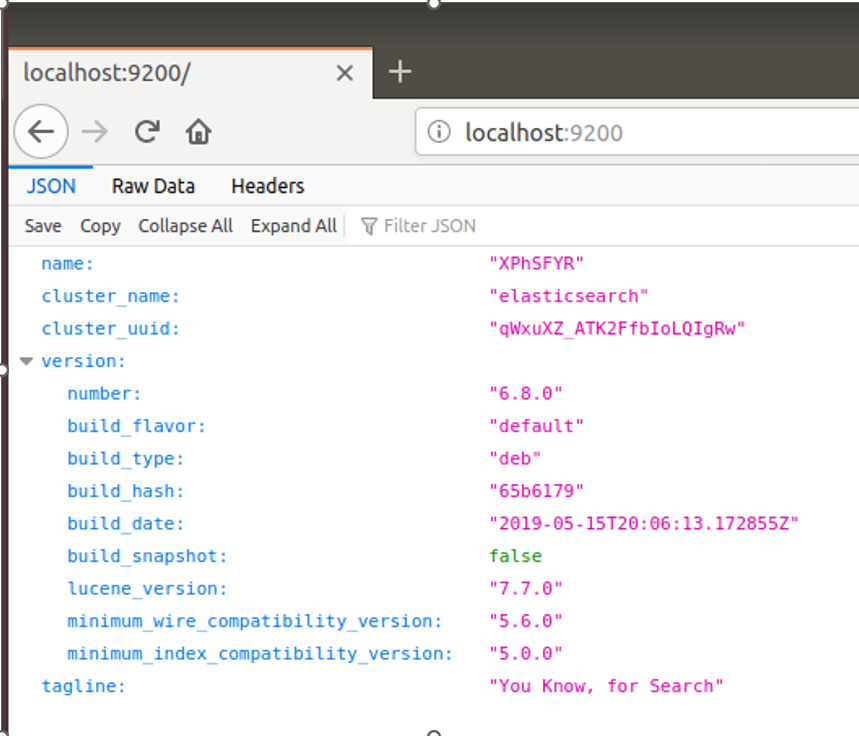
$ systemctl start elasticsearch.serviceTo check if the Elasticsearch service is running, check the logs under /var/log/elasticsearch/ or send an HTTP request to NodeIP:9200.
The HTTP request response should be as follows:
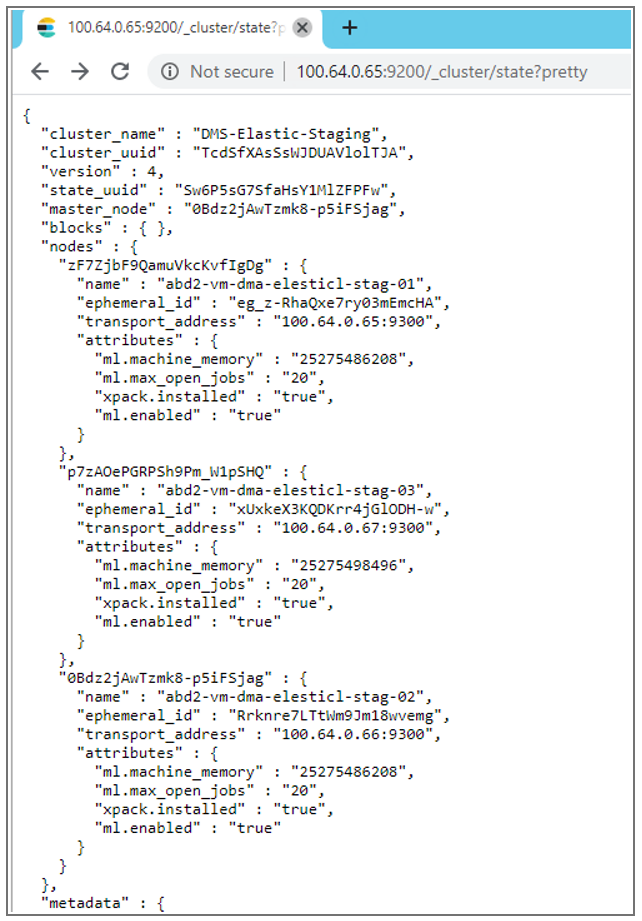
Connect to one of the nodes using a web browser, and check the cluster status by going to
http://<NodeIP>:9200/_cluster/state?pretty.The response should be as follows:
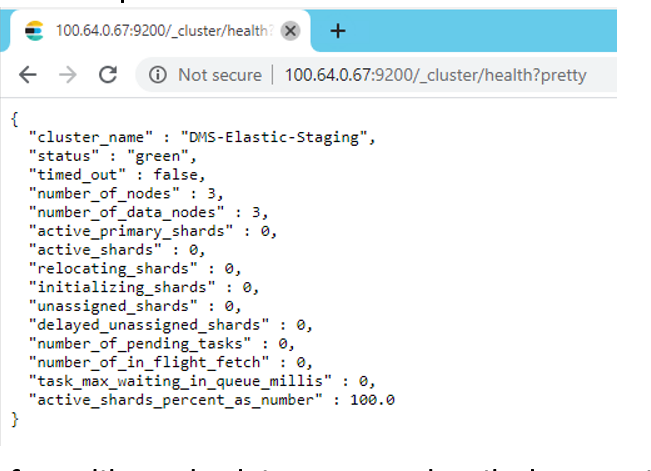
To check the cluster health status, go to
http://<NodeIP>:9200/_cluster/health?pretty.The response should be as follows:
If your system uses a dedicated clustered storage setup, configure the Elasticsearch cluster database in System Center. See Configuring Elasticsearch in System Center.
If your system uses storage per DMA, you will need to manually connect your DMA to the Elasticsearch database