Leveraging controls and feeds to create a dynamic GQI query
In this tutorial, you will discover how to harness controls and feeds that are used in a GQI query. An update to the user input will lead to an updated GQI result. This is especially useful for visualizations that do not support any filtering.
Expected duration: 10 minutes
Note
The content and screenshots for this tutorial have been created with the DataMiner 10.4.1 web apps.
Prerequisites
A DataMiner System that is connected to dataminer.services.
Version 10.3.5 or higher of the DataMiner web apps.
Overview
- Step 1: Install the dummy data sources package
- Step 2: Create a dashboard and add a text input
- Step 3: Add a query and visualize it
- Step 4: Replace the static filter value with a feed
Tip
See also: Kata #13: Controls and feeds in a low-code app on DataMiner Dojo 
Note that this kata also showcases the data input of the text input component, which is not included in the tutorial below. This is a feature that is available from 10.3.0 [CU10]/10.4.1 onwards.
Step 1: Install the dummy data sources package
Click the Deploy button to deploy the IPAM - GQI dummy data sources packages on your DMA.
This package contains data that will be used in this tutorial.
Step 2: Create a dashboard and add a text input
Add a Text input component so the user can enter a search term:
In edit mode, drag and drop the Text input visualization from the pane on the left on to the main dashboard area.
Select the input and go to the Layout pane where you can configure additional options to style the input.
Fill in "VLAN name" as the placeholder for the text input.
Search for "Filter" in the Icon option and and select an applicable icon.
Your text input should look like this:

Step 3: Add a query and visualize it
Create a GQI query using the "IP subnets - Dummy" ad hoc data source.
Add a GQI operator of type "Filter":
Select the "VLAN Name" as the column to filter on.
Select the "contains" filter method.
Fill in the "VLAN 1" as the value for the filter.
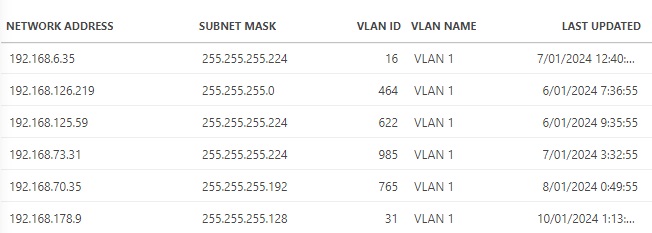
Visualize the result in a Table component.
The result should look like this:
Step 4: Replace the static filter value with a feed
Edit the GQI query again and open the filter operator.
In the Value box, click the "Link to feed" icon (or the "Link to data" icon in DataMiner 10.3.0 [CU21]/10.4.0 [CU9]/10.4.12 or higher).
This icon is used everywhere a user can link a value to data.

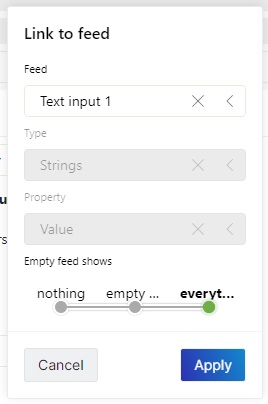
Clicking the icon opens the Link to feed dialog (or Link to data in recent DataMiner versions), which will ask for a specific feed or data, the type, and a property.
Specify the necessary info in the dialog:
In the first box, select "Text input 1".
You will notice that the type and property are automatically filled in if only one possible value is available.
To determine what the behavior should be when the feed is empty, at the bottom of the dialog, select everything.
This determines what will happen when the user does not fill in any value in the text input. Selecting everything ensures that all data is retrieved in this case.
Tip
If you want the text input to behave like a search engine, you can select nothing instead. This will not retrieve any data until the user fills in a value in the text input.
Leave the dashboard edit mode using the button in the top-right corner.
In the text input of the dashboard, fill in the value "VLAN 2".
As soon as you press Enter or click outside the textbox, the filter will be applied in the table.
Note
This is the default behavior for the text input. You can customize this in the Settings pane of the text input, so that this for instance happens as soon as the value changes, or only if Enter is pressed.
Learning paths
This tutorial is part of the following learning path: