Getting started with EPM
This tutorial will provide a brief introduction on how you can use many EPM-specific features, including how you can add a new collector to your EPM setup, filter out irrelevant EPM alarms, use EPM feeds in dashboards and low-code apps, and link EPM entities to views.
Expected duration: 30 minutes
Note
The content and screenshots for this tutorial have been created using DataMiner version 10.4.5.
Tip
See also: Kata #38: Getting started with DataMiner EPM on DataMiner Dojo 
Prerequisites
- A DataMiner System that is connected to dataminer.services.
- DataMiner Cube 10.4.0 [CU14]/10.5.0 [CU2]/10.5.5 or higher, or else a soft-launch configuration where the CPEIntegration option is enabled.
Tip
A DataMiner as a Service system comes with a dataminer.services connection out of the box and has most soft-launch options enabled, so it automatically meets this requirement.
Overview
This tutorial consists of the following steps:
- Step 1: Deploy the DataMiner EPM Integration Training package from the Catalog
- Step 2: Create a new collector element and rebalance the system
- Step 3: Use EPM relations to filter out alarms
- Step 4: Use the EPM feed in a dashboard
- Step 5: Link EPM entities to views
Step 1: Deploy the DataMiner EPM Integration Training package from the Catalog
Go to https://catalog.dataminer.services/details/b661f936-d6e7-447c-baee-f0a5503e75b4.
Deploy the Catalog item to your DataMiner Agent by clicking the Deploy button.
Tip
See also: Deploying a Catalog item to your system
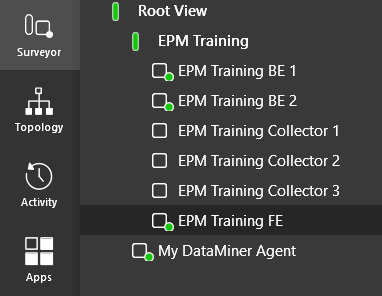
In DataMiner Cube, check whether the following items have been added to your DataMiner Agent:
A view named EPM Training.
A front-end element named EPM Training FE.
Two back-end elements named EPM Training BE 1 and EPM Training BE 2.
Three collector elements named EPM Training Collector 1, EPM Training Collector 2, and EPM Training Collector 3.
The Topology app in between the Surveyor and Activity module.
Note
If the Topology app does not show up right away, close and reopen Cube.
Step 2: Create a new collector element and rebalance the system
The EPM architecture allows horizontal scaling: you can add more collector elements at any time to reduce the load on individual elements without adding any load to the front-end element. In this step, you will add such a collector element and then rebalance the system.
Create a new collector element in the EPM Training view:
Open the Surveyor in DataMiner Cube.
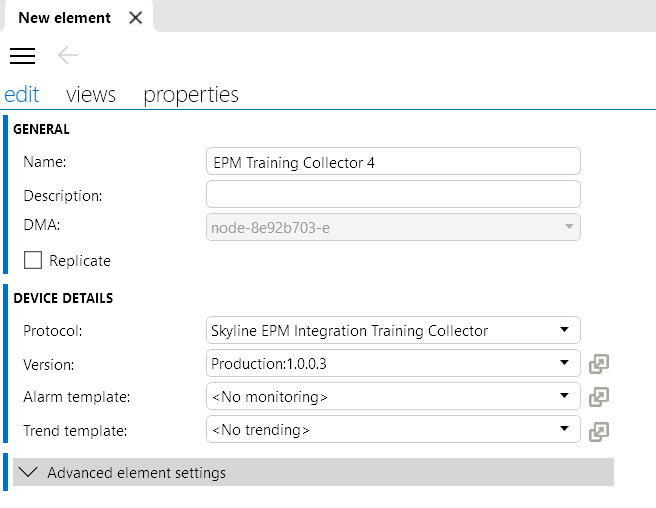
Right-click the EPM Training view (e.g. the root view), and select New > Element.
Enter the element name EPM Training Collector 4, select the DMA where the element should be added, select the Skyline EPM Integration Training Collector protocol, and click Create.
Note
If you are using a DMS consisting of multiple DMAs, select the same DMA as the one hosting the EPM Training BE 2 element. If you do not know which DMA is hosting this element, right-click this element and select Properties. The DMA ID is the first number in the ID, before the slash.
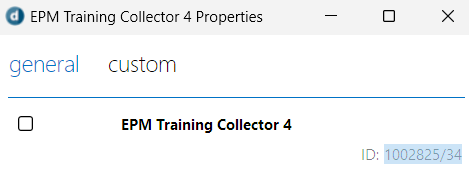
Right-click the newly created element, select Properties, and copy the DMA ID/element ID of the element.
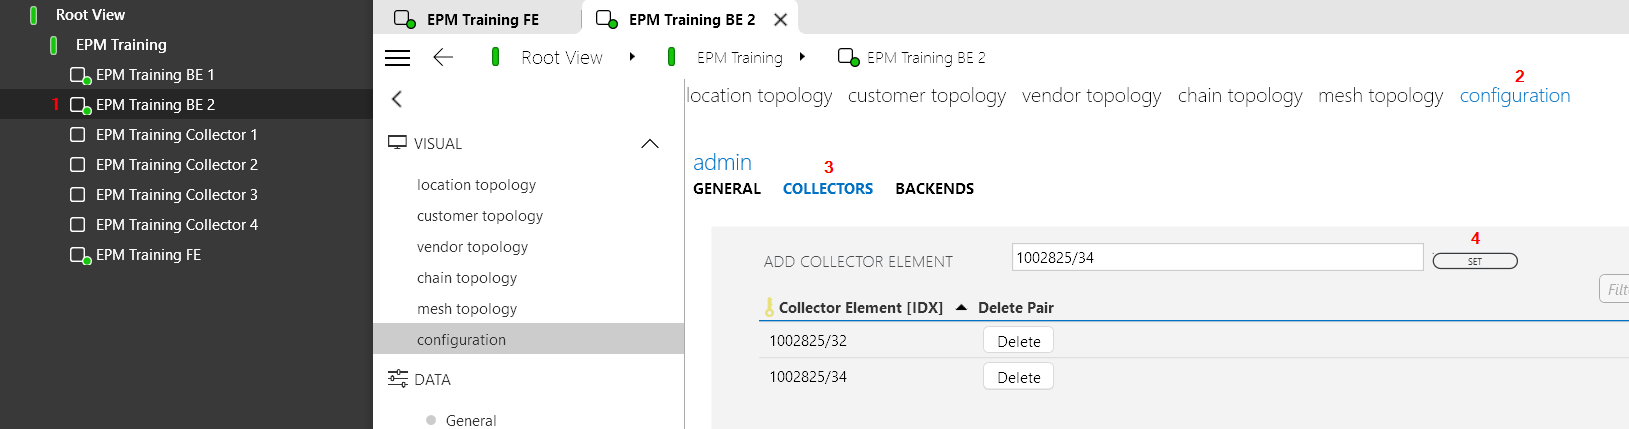
Configure the EPM Training BE 2 element as the parent manager of the EPM Training Collector 4 element:
Open the EPM Training BE 2 (1) element, and go to the Configuration visual page (2) and then the Collectors tab (3).
Paste the DMA ID/element ID you copied earlier into the Add Collector Element box, and click SET (4).
Register the new element in the front-end configuration:
Open the Topology app (1), select the Configuration topology chain (2), and click the ">" button (3).
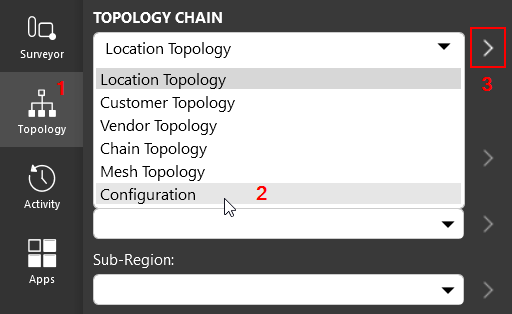
This will open the Configuration visual page of the EPM front-end element.
On the Configuration visual page (1), go the Collectors tab (2).
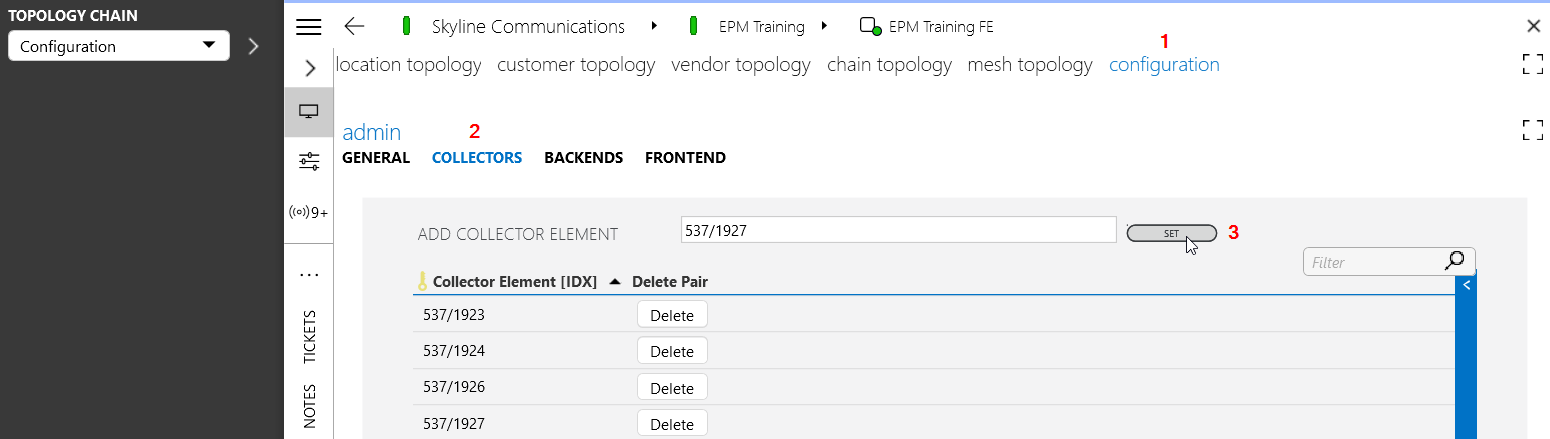
Paste the DMA ID/element ID you copied earlier into the Add Collector Element box, and click SET (3).
Initiate the front-end provisioning cycle:
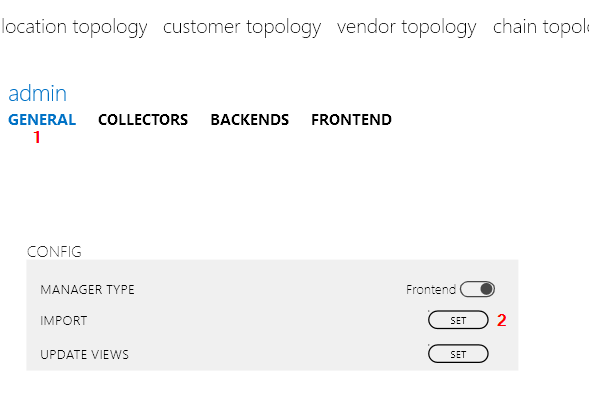
Navigate to the General tab (1) of the EPM Training FE element.
Next to Import, click the SET button (2).
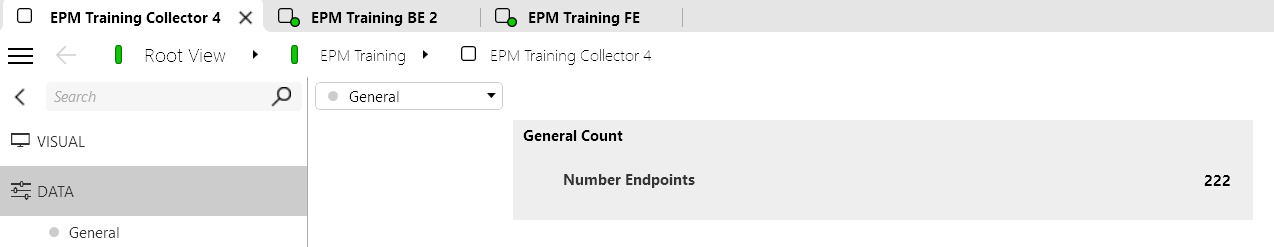
The Manager connector will now redistribute the load on the collectors, to prevent one element from having too much data.
To confirm whether this has been completed successfully, open the EPM Training Collector 4 element and check whether the Number Endpoints parameter on the General page is filled in.
Step 3: Use EPM relations to filter out alarms
At this point, all of the collectors have pinged their endpoint devices, and a lot of station alarms are created. This happens because many of these stations only have 1 endpoint associated with them. You can filter these alarms to only show station alarms where the issue is only present on the station and not on the "Hub" parent entity level.
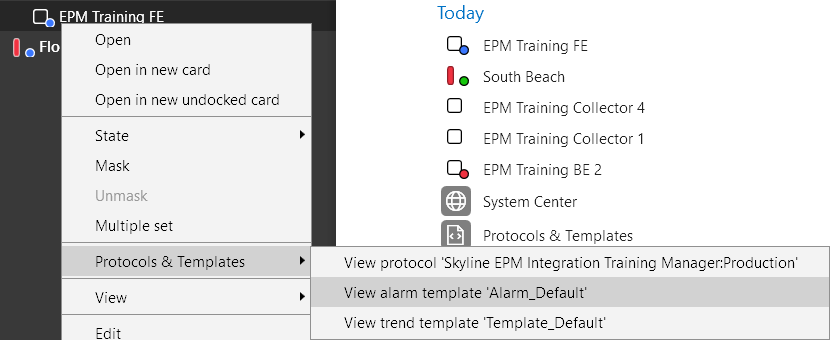
Right-click the EPM Training FE element and select Protocols & Templates > View alarm template 'Alarm_Default'.
This will open the alarm template assigned to the EPM Training FE element.
In the alarm template, scroll down to the Station section and locate the Percentage Unreachable Endpoints parameter, then scroll to the right until you can see the Condition column.
In the Condition column, click the row of the Percentage Unreachable Endpoints parameter, and select <New>.
Configure an alarm template condition to filter out any Station Unreachable Endpoints alarms when the parent hub is also in alarm for the same KPI:
Name the condition Hub Relation.
Click Select a filter and select the Hub Overview Table: Percentage Unreachable Endpoints parameter.
Click Equal to and select Greater than instead.
Click <Click to select> and enter the value
24.9.
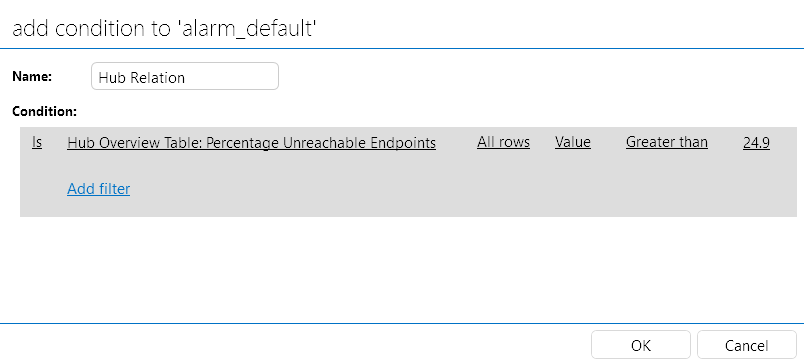
Click OK to save the condition and OK again to save the alarm template.
With this configuration, if the parent hub has 25% or more unreachable endpoints, the station alarm will be ignored.
The system should now have a large decrease in critical alarms.
Step 4: Use the EPM feed in a dashboard
In dashboards and low-code apps, you can add an EPM feed component to allow users to select an EPM filter. This component should always be linked to a front-end EPM manager element. While the steps below describe how you can do this in a dashboard, this is very similar in a low-code app.
Create a new Customer folder in the Training folder:
Right-click the Training folder and select Create folder.
Enter the name Customer and click Create.
Create a new dashboard in the new folder:
Right-click the Customer folder and select Create dashboard.
Enter the name 01. Device Overview and click Create.
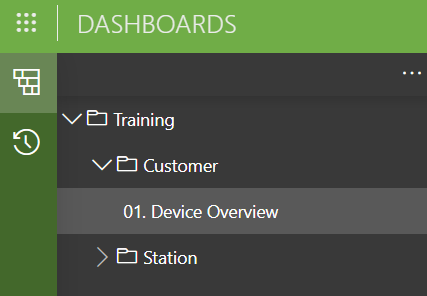
The new dashboard will automatically be opened in edit mode.
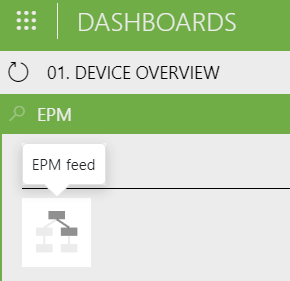
Add an EPM feed component to the dashboard:
Hover the mouse pointer over the sidebar on the left, so that the visualizations pane is shown.
In the search box at the top, enter EPM.
Click and drag the EPM feed visualization to the top of the dashboard.
Link the component to the front-end element:
In the Data pane on the right, expand the Elements item and select EPM Training FE.
Drag the EPM Training FE item to the component you added earlier.
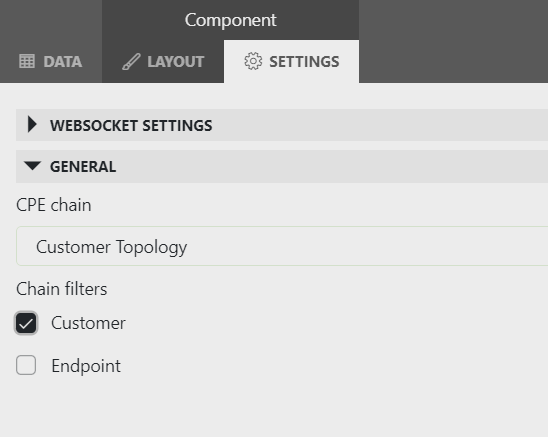
Configure the topology information for the component:
Make sure the EPM feed component is selected on the dashboard, and go to the Settings tab in the pane on the right.
Under General, in the CPE Chain box, select Customer Topology.
Select the checkbox next to Customer.
Adjust the component size by dragging its edges, until it covers the top area of the dashboard.
Create a new query:
In the Data pane, expand the Queries section and click the "+" button.
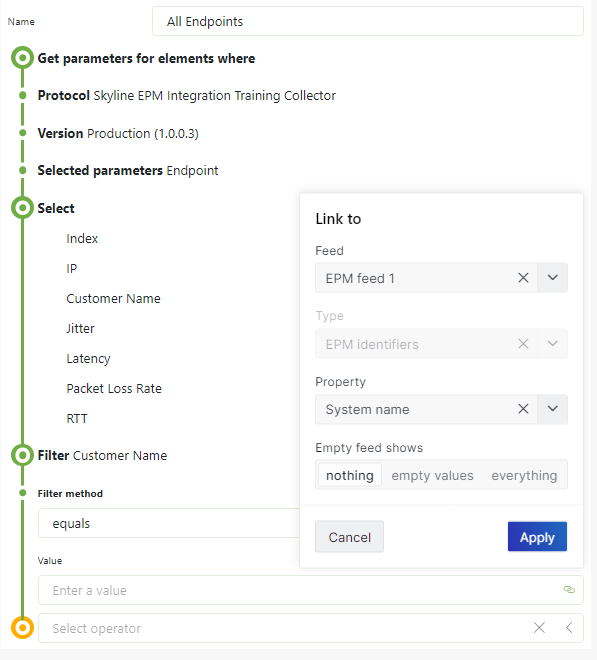
Enter the name All Endpoints.
Select the data source Get parameters for elements where.
In the Type box, select Protocol.
In the Protocol box, select Skyline EPM Integration Training Collector.
In the Protocol Version box, select Production.
In the list of parameters, select Endpoint to get the parameters from the Endpoint Overview Table.
Below this, add the Select operator, so you will be able to select specific columns from the Endpoint Overview Table.
Make sure only the following parameters are selected: Index, IP, Customer Name, Jitter, Latency, Packet Loss Rate, and RTT.
At this point, the query will return all the endpoint information from all of the collectors.
Select the Filter operator.
With this additional operator, you will filter the results so only the endpoints associated with the customer selected in the EPM feed are returned.
In the Column box, select Customer Name.
In the Filter method box, select equals.
In the Value, click the link icon on the right, select EPM Feed 1 in the Feed box and System name in the Property box, and click Apply.
At this point, your query should look like this:
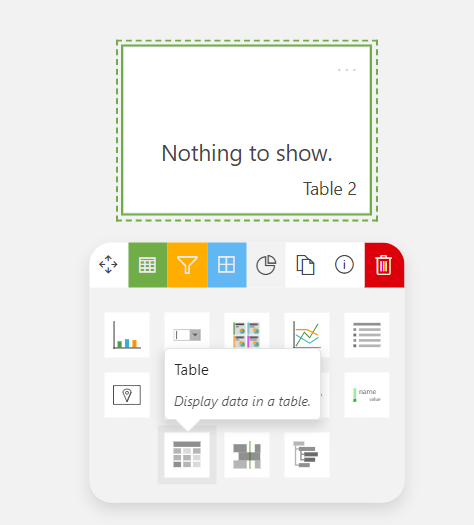
Drag the query onto the dashboard to create an empty component.
Hover the mouse pointer over the new component, click the pie graph icon in the menu that appears below it, and select the Table visualization.
This will change the new component into a table component.
Drag the edges of the component so that it takes up the remaining white space of the dashboard.
In the top-right corner, click Stop editing.
Your dashboard should now look similar to this:
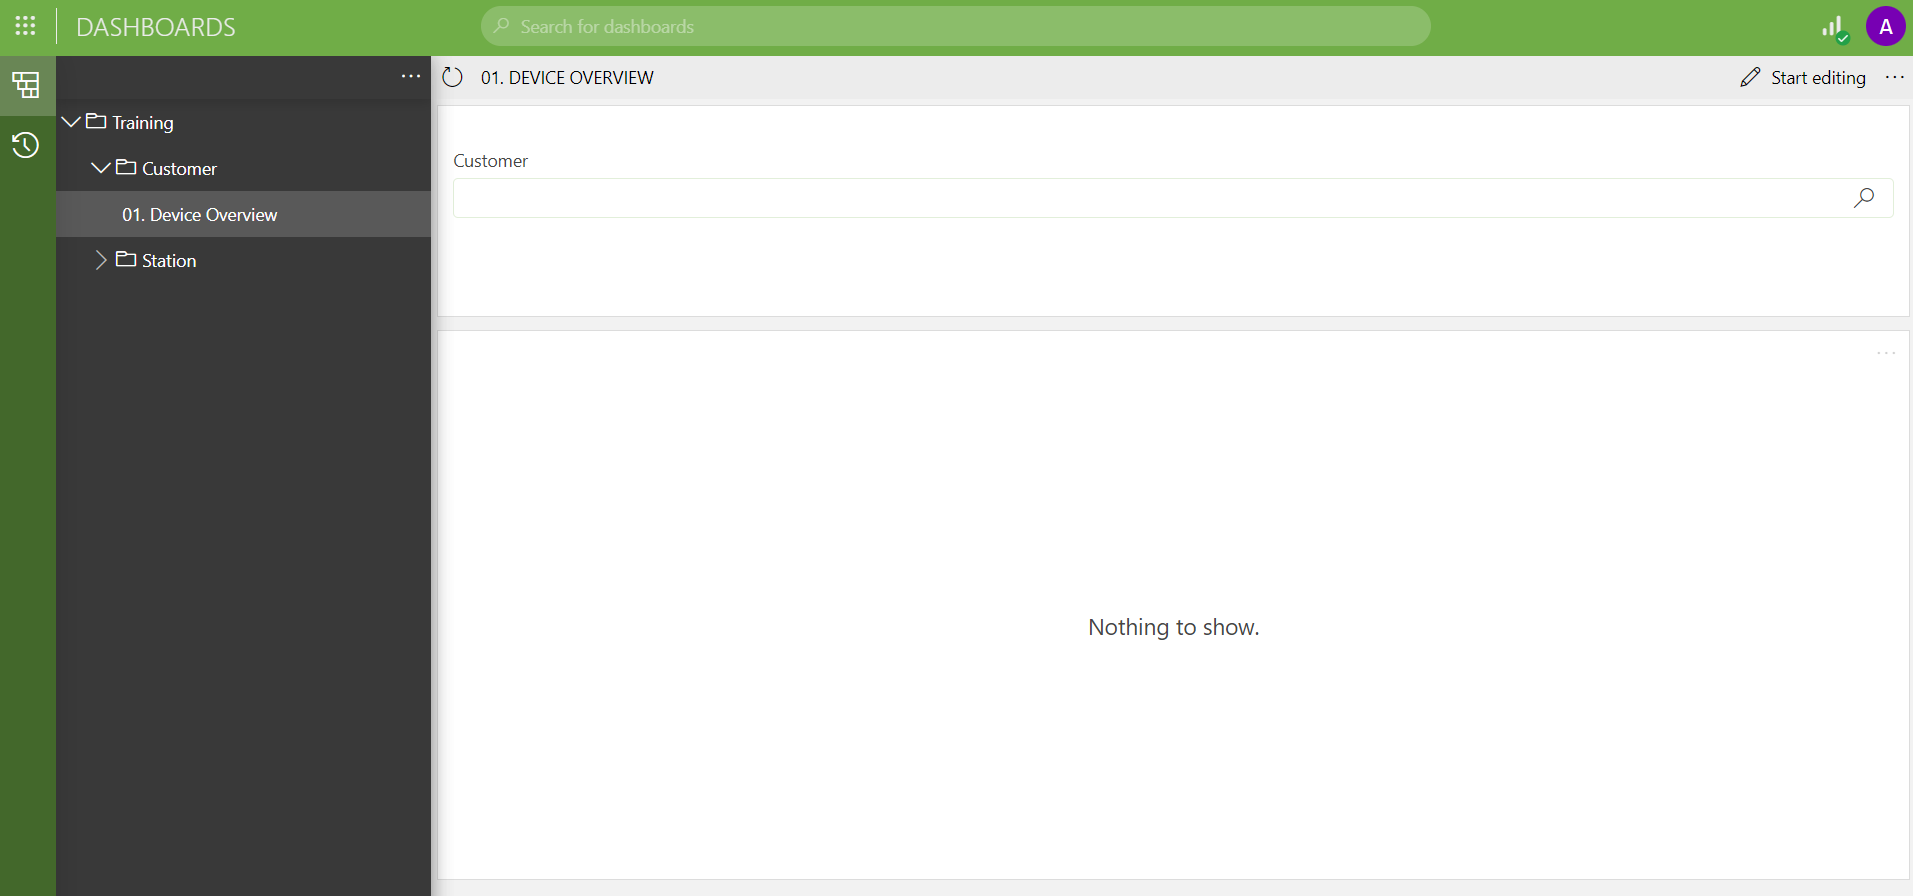
To test the dashboard, select a customer in the EPM feed, and check if the table below is updated to show all the endpoints associated with the selected customer.

Step 5: Link EPM entities to views
In this final step, you will learn how you can link EPM entities to views in DataMiner Cube, so that selecting such a view will show the relevant EPM information.
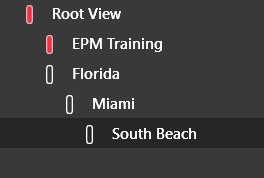
In DataMiner Cube, add several new views to create a tree structure showing the relationships between specific locations:
In the Surveyor, right-click the root view and select New > View, then name the new view Florida.
Right-click the view Florida and select New > View, then name the new view Miami.
In the same way, add the new view South Beach to the view Miami.
Update the views in the front-end element:
In the Topology app, select the Configuration topology chain, and click the ">" button.
Next to Update Views, click the SET button.
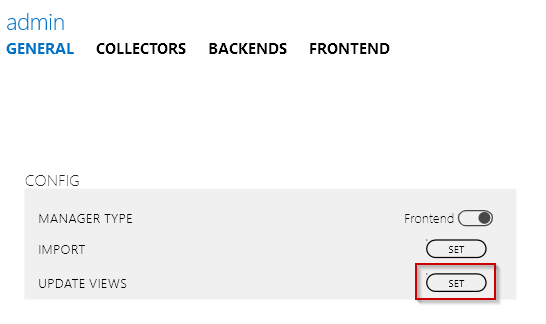
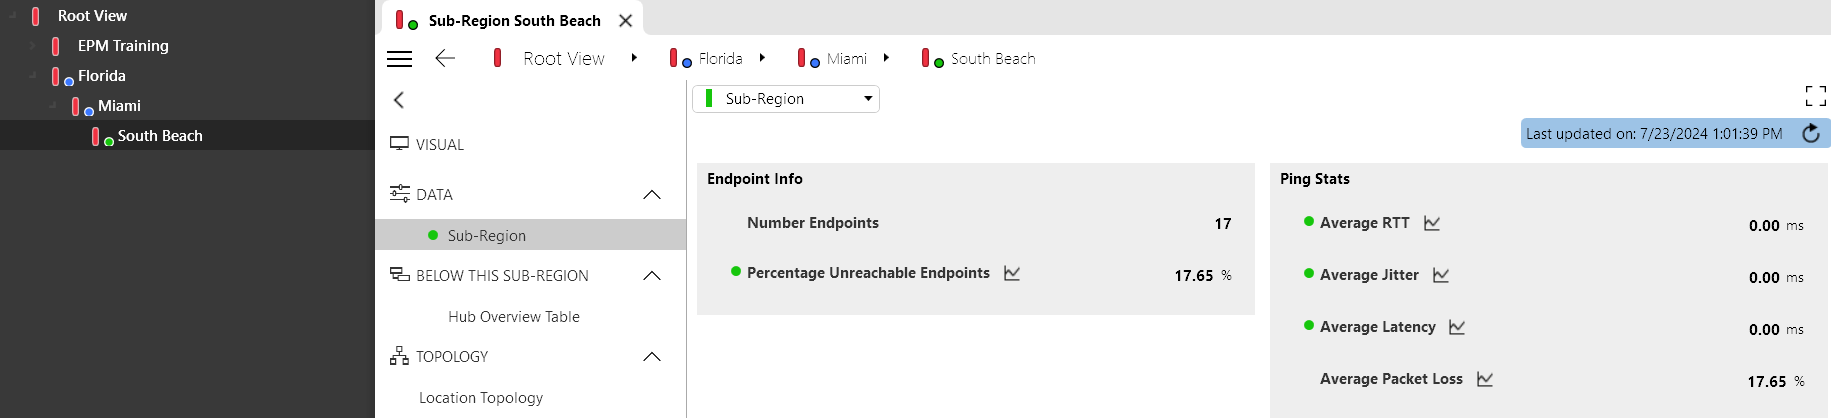
All the views will now be linked to their EPM objects and inherit their alarm properties from the EPM entity. Selecting any of the views will show a data section displaying the EPM KPI information.
Important
As EPM setups can use quite a lot of element data, if you have completed the tutorial and you no longer need the setup from this tutorial, we highly recommend stopping or removing the elements that were added during the tutorial.