Detecting anomalies with DataMiner
This tutorial illustrates DataMiner's Behavioral Anomaly Detection features and shows how you can use these to detect certain failures in your operation.
By default, behavioral anomaly detection is active on trended parameters. It will monitor the parameters in real time and notify users about any detected anomalies. The feature models the behavior of a parameter based on its recent history. The tutorial will make use of history sets to quickly simulate a parameter with historical trend data. Trending is activated by default on the parameters used in this tutorial.
Estimated duration: 45 minutes.
Note
The content and screenshots for this tutorial were created in DataMiner 10.3.12.
Tip
- For more information, such as technical limitations of anomaly detection, see Working with behavioral anomaly detection.
- See also: Kata #12: Automatically detect anomalies with DataMiner on DataMiner Dojo

Prerequisites
DataMiner 10.3.12 or higher with Storage as a Service (STaaS) (recommended) or a self-managed Cassandra database.
A DataMiner System connected to dataminer.services.
Behavioral Anomaly Detection is enabled (in DataMiner Cube: System Center > System settings > analytics config).
The time to live for trending is at least 1 day for real-time trending and 1 month for minute records.
Overview
The tutorial consists of the following steps:
- Step 1: Install the example package from the Catalog
- Step 2: Discover anomaly detection in trend graphs
- Step 3: Discover anomaly detection in the Alarm Console
- Step 4: Make DataMiner generate alarms for anomalies
- Step 5: Make DataMiner generate alarms for specific anomaly types
- Step 6: Set custom alarm thresholds
- Step 7: Final exercise
Step 1: Install the example package from the Catalog
Go to https://catalog.dataminer.services/details/package/5467.
Deploy the Catalog item to your DataMiner Agent by clicking the Deploy button.
This will create several DataMiner elements in your system that will be used throughout the rest of the tutorial. The elements will be located in the view DataMiner Catalog > Augmented Operations > Anomaly Detection Tutorial.
Step 2: Discover anomaly detection in trend graphs
In DataMiner Cube, select the element Anomaly Detection Tutorial - Audio bit rate in the Surveyor.
This element simulates a parameter monitoring the bit rate of an audio channel on an encoder.
Click the Generate Data button to generate data for the parameter Audio Bit Rate Channel 1.
Note
The protocols used in this tutorial can only load data for a parameter once. If you have made a mistake or want to retry an exercise, you can rerun the simulation by duplicating the element and generating the data again on the duplicated element.
Wait until the Data Generated? parameter displays Yes.
Click the trend icon
 next to the Audio Bit Rate Channel 1 parameter.
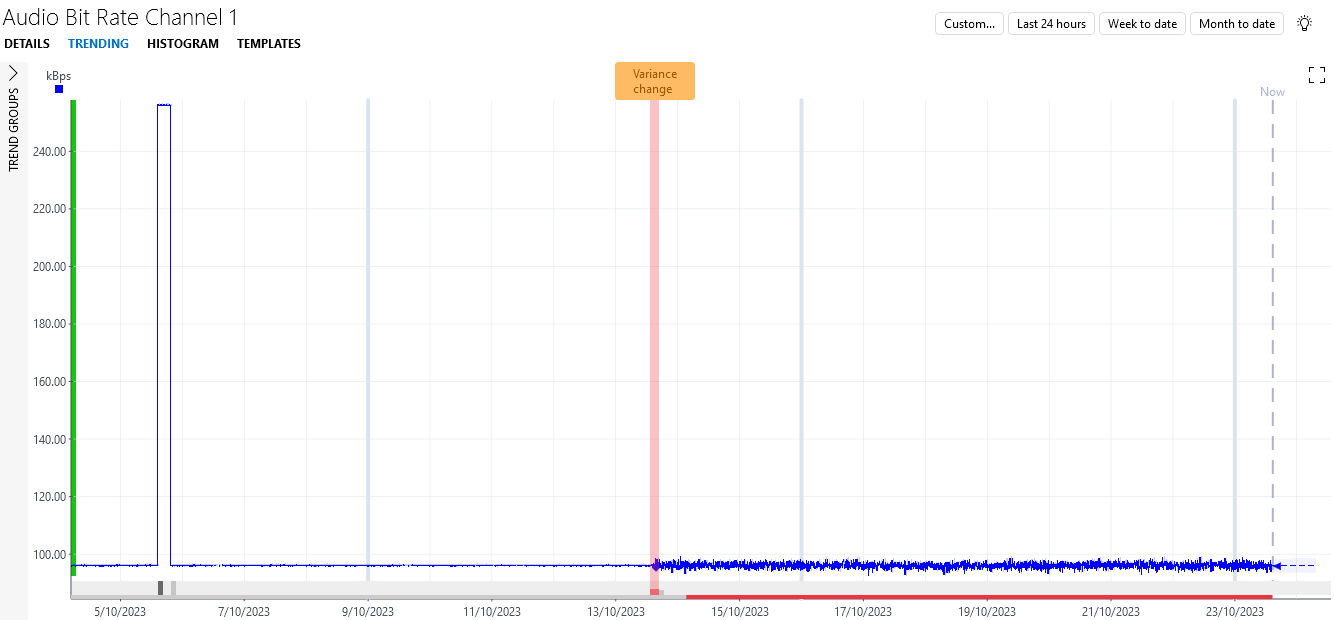
Click Month to date to see data for the past month.
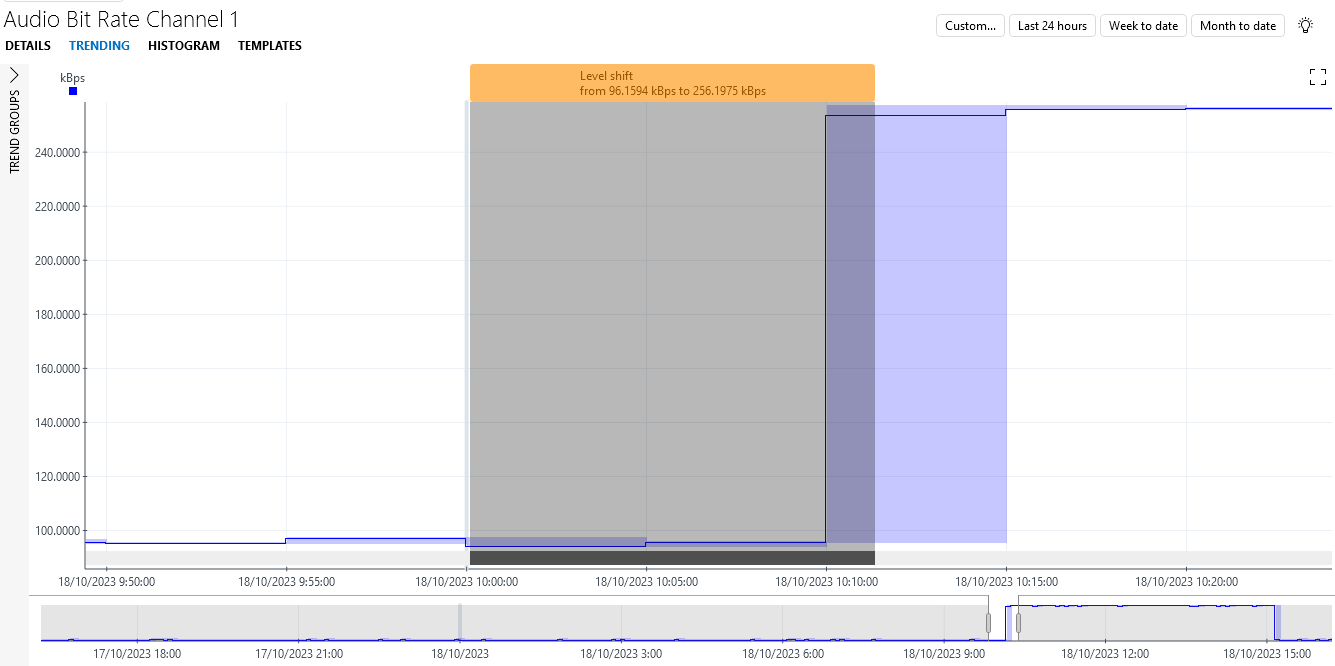
You will see that the bitrate first remained stable around 96 kBps for the better part of two weeks before temporarily jumping up a few times to values around 256 kBps. Finally, after 5 jumps, there is one jump to over 1000 kBps.
Under each of the jumps up and down, a gray or black block is displayed. These blocks indicate a detected change in behavior, or change point.
Tip
For more information on the possible types of change points, see Working with behavioral anomaly detection
Hover the mouse pointer over a change point to see more detail about the type of change point (e.g. a level shift). If necessary, zoom in to see all details, such as the begin and end values.
Note
In the example, the blocks under the first two jumps have a darker color, because these are considered to be an anomaly. This is because when the first jump occurs, the parameter has never had similar behavior before. By the third jump, the algorithm has seen sufficient similar behavior to no longer consider the behavior anomalous. However, the jump towards the end is again considered anomalous, as it is much bigger than the previous ones.
Step 3: Discover anomaly detection in the Alarm Console
In DataMiner Cube, select the element Anomaly Detection Tutorial - Encryption Key Requests in the Surveyor.
This element simulates a parameter monitoring the number of encryption key requests received per minute by a CAS server.
Click the Generate Data button to generate data for the parameter Encryption Key Requests.
Wait until the Data Generated? parameter displays Yes.
Click the light bulb icon in the top-right corner of the Alarm Console.
This icon lights up in blue to indicate that DataMiner Analytics found something interesting. For more detailed info, see Working with the Alarm Console light bulb feature.
Click the menu item 2 anomalies were found in your trend data (this can also be a a higher number if your system has detected anomalies on other elements).
A new Anomalies tab will now be shown in the Alarm Console, listing the detected anomalies.
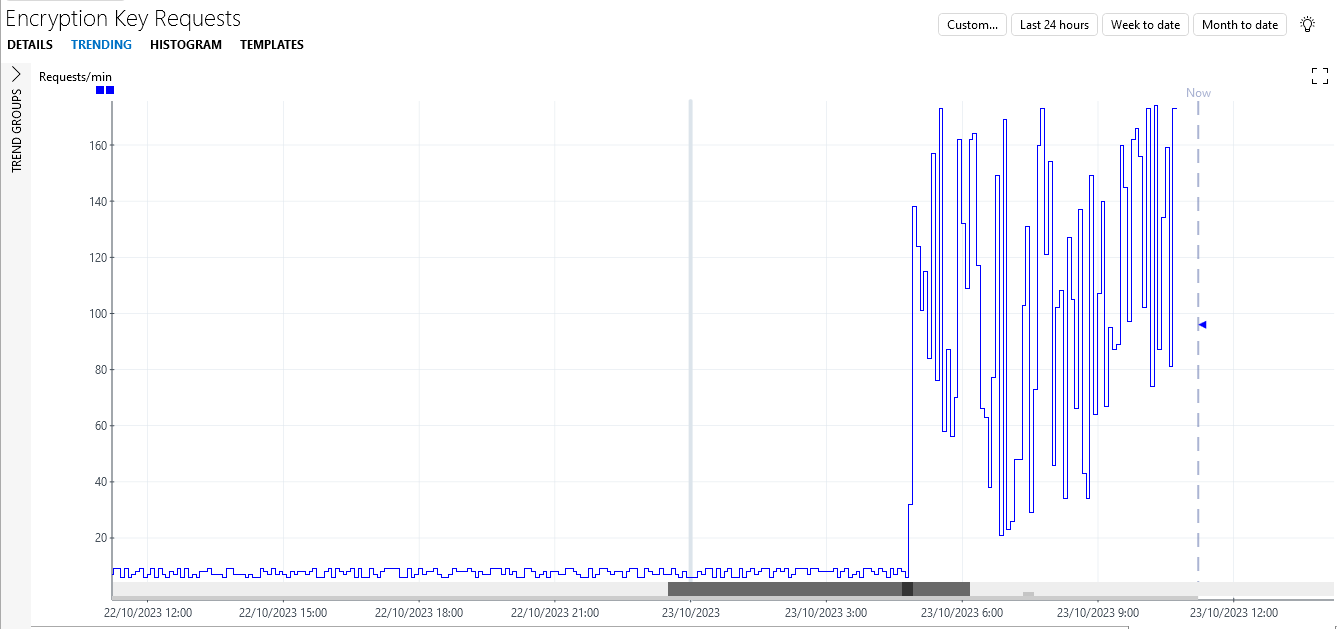
Double-click one of the listed anomalies for the element Anomaly Detection Tutorial - Encryption Key Requests to view the trend graph of the parameter.
The trend graph will show that the number of requests per minute remained relatively stable for a long time but suddenly increased spectacularly a few hours ago, indicating that unexpected activity may be going on in the network.
Note
You can also find the anomalies using the Suggestion events tab. To do so, click the plus icon in the header of the Alarm Console, and then select Show current > Suggestion events. This will open a tab with all suggestion events, including the two anomalies on Encryption Key Requests. However, this tab page can show more than only the anomalies. See Advanced analytics features in the Alarm Console for more information.
Step 4: Make DataMiner generate alarms for anomalies
As anomalies might flag potential problems in your operation, it can be useful to show alarms for these events.
Create an alarm template for the example element Anomaly Detection Tutorial - Encryption Key Requests 2:
Right-click the element Anomaly Detection Tutorial - Encryption Key Requests 2 in the Surveyor, and select Protocols & Templates > Assign alarm templates > New alarm template.
Note
This element is a copy of Anomaly Detection Tutorial - Encryption Key Requests, which generates the same data.
Specify a name for the alarm template, e.g. Monitoring of anomalies, and click OK.
Select the checkbox in the MON column for the parameter Encryption Key Requests.
This will enable alarm monitoring for this parameter.
Scroll to the far right of the alarm template to find the ANOMALIES column.
This column contains a button showing whether alarm monitoring for anomalies is currently enabled. By default, it will show Disabled.
Click the button in the ANOMALIES column.
This will open a new pop-up window where you can configure alarm monitoring for anomalies.
In the dropdown box at the top, which by default shows All disabled, select All smart.
Click Close to close the window.
Click OK to save the alarm template.

You have now enabled alarm monitoring for all types of anomalies detected on the parameter Encryption Key Requests. This means that anomalies that would previously be shown in the Suggestion events tab will now be shown in the Active alarms tab.
Simulate the data so that anomalies are detected:
In DataMiner Cube, select the element Anomaly Detection Tutorial - Encryption Key Requests 2 in the Surveyor.
Click the Generate Data button to generate data for the parameter Encryption Key Requests.
Wait until the Data Generated? parameter displays Yes.
In the Alarm Console, check the Active alarms tab.

Two anomalies marked as critical will be displayed in the Active alarms tab. This severity is determined by how severe DataMiner considers the anomaly to be. Larger jumps will for instance be considered more severe than lower jumps. Note that the Anomalies tab, which you can open via the light bulb icon, still contains these events, while the Suggestion events tab now does not.
Double click one of the anomaly alarms to inspect the trend data.
Note that the anomalies are now indicated in red at the bottom of the trend graph, corresponding to the critical severity of the alarm that was generated.
Step 5: Make DataMiner generate alarms for specific anomaly types
In some cases, it can be useful to only generate alarms for certain types of anomalies, for example the bit rate parameter from step 2 above. The jumps between different encoding bit rates might be expected, depending on the stream that gets encoded at that time, but you might want to get notified if the bit rate starts fluctuating a lot on a certain stream (e.g. because it is being encoded using a variable bit rate scheme instead of a constant bit rate scheme). You can do this by activating alarm monitoring for variance changes only:
Create an alarm template:
Right-click the element Anomaly Detection Tutorial - Audio bit rate (CBR-VBR) in the Surveyor, and select Protocols & Templates > Assign alarm templates > New alarm template.
Specify a name for the alarm template, e.g. Variance change monitoring, and click OK.
Select the checkbox in the MON column for the parameter Audio Bit Rate Channel 1.
Scroll to the far right of the alarm template to find the ANOMALIES column.
Click the button in the ANOMALIES column.
In the pop-up window, select Variance increase and Variance decrease.

Click Close to close the window.
Click OK to save the alarm template.
Simulate the data so that anomalies are detected:
Select the element Anomaly Detection Tutorial - Audio bit rate (CBR-VBR) in the Surveyor.
Click the Generate Data button to generate data for the parameter Audio Bit Rate Channel 1.
Wait until the Data Generated? parameter displays Yes.
In the Alarm Console, check the Active alarms tab.
A variance increase alarm will show up in this tab.
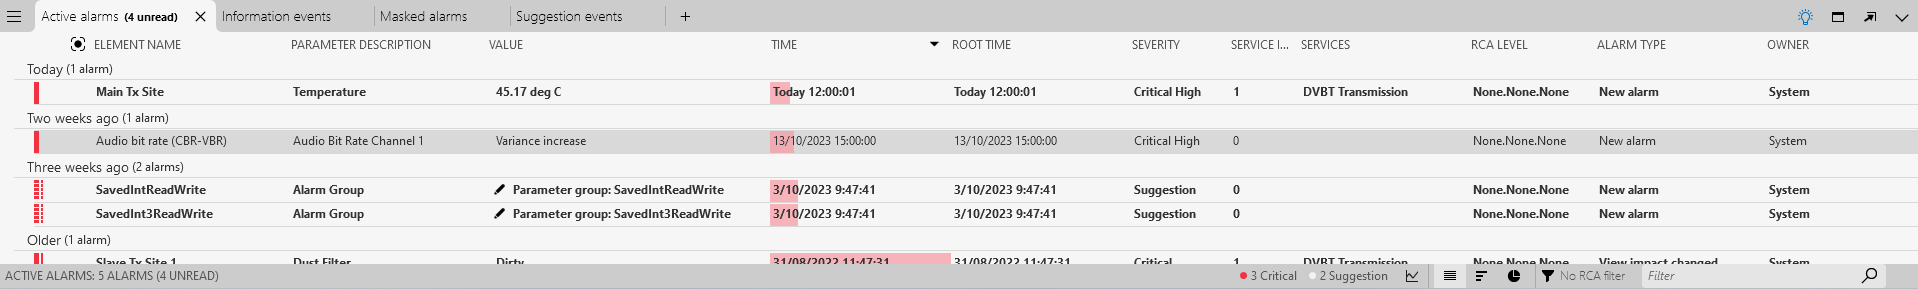
Double-click the alarm.
You will see that the alarm indeed corresponds to a region with a much higher fluctuation in bit rate than normal. Note that the other anomalies that are detected on the parameter only show up in the Suggestion events tab and not in the Active alarms tab.
Tip
It would be very difficult to configure similar alarm monitoring behavior using static alarm thresholds. This shows the power of anomaly alarm monitoring for detecting sudden unexpected behavior. For a complete list of all options related to alarm monitoring of anomalies, see Configuring Augmented Operations alarm settings.
Step 6: Set custom alarm thresholds
In the previous steps, DataMiner determined autonomously whether certain behavior was considered anomalous or not. However, sometimes it can be handy to add some more configuration to give DataMiner more input. In this example, you will configure specific thresholds for alarm monitoring of level shift anomalies.
Check the current behavior with the example element Anomaly Detection Tutorial - Cable Modems Out of Service:
Select the element in the Surveyor.
Click the Generate Data button to generate data for the parameter Anomaly Detection Tutorial - Cable Modems Out of Service.
Wait until the Data Generated? parameter displays Yes.
Click the trend icon
next to the parameter.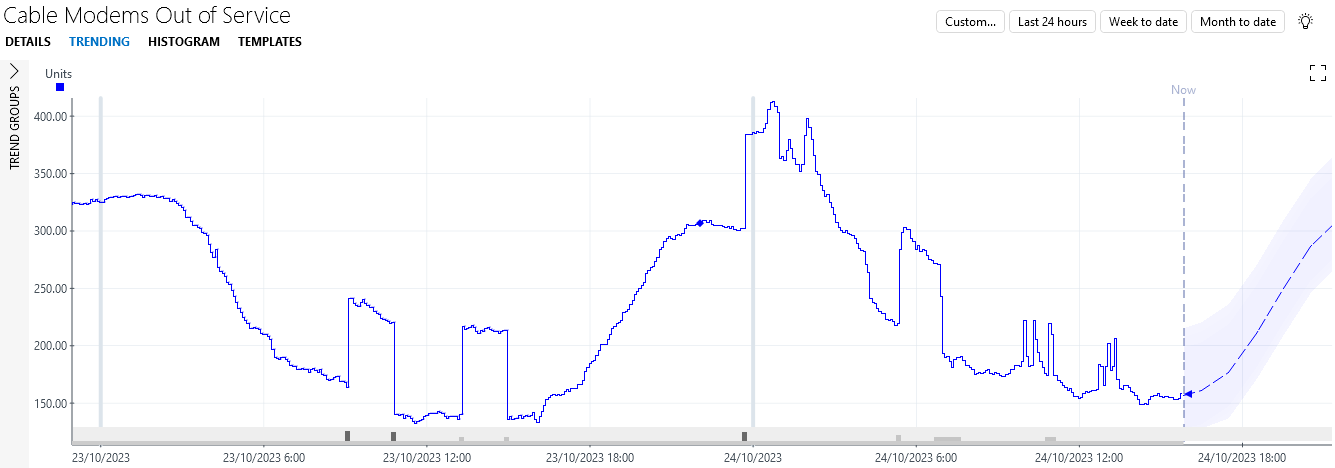
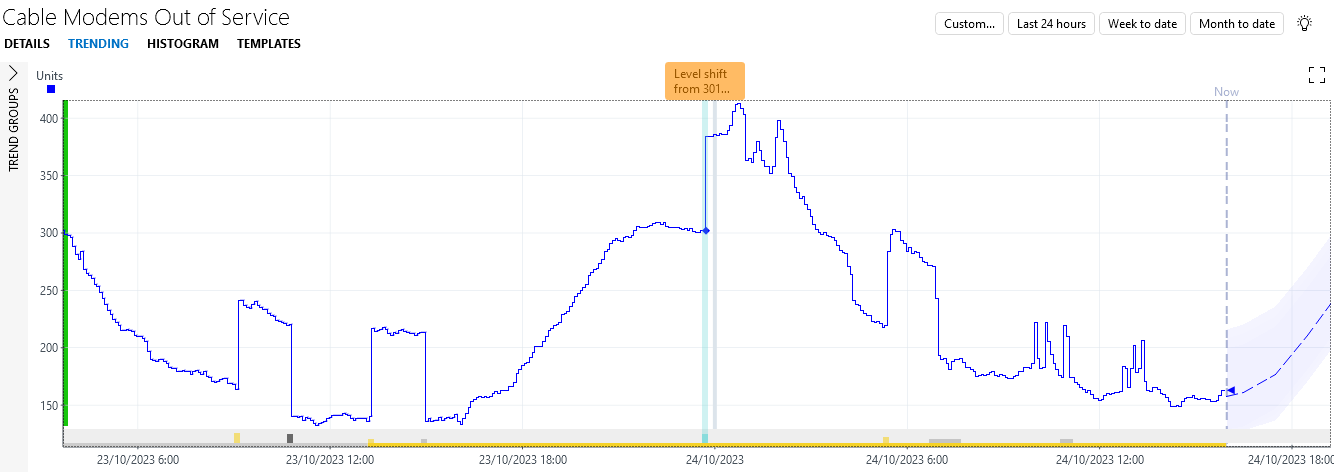
As you can see, the data tends to follow a wave pattern with a low number of cable modems out of service during the day, and a high number at night. This is caused by a significant number of people turning off their cable modem at night, making the CMTS unable to connect to it. Moreover, in the last two days, you can see four periods where more modems were out of service than expected: the data suddenly jumps up with around 70 units before dropping again a few hours later. Unfortunately, DataMiner only detects the first and the third period as anomalous, as seen by the dark grey blocks in the trend graph. This is because DataMiner assumes too quickly that the observed behavior is not anomalous since it has seen it before.
Configure level shift anomaly alarm detection for the element Anomaly Detection Tutorial - Cable Modems Out of Service 2, so that alarms are generated during all four periods of anomalous behavior:
Right-click the element Anomaly Detection Tutorial - Cable Modems Out of Service 2 in the Surveyor, and select Protocols & Templates > Assign alarm templates > New alarm template.
Note
This element is a copy of Anomaly Detection Tutorial - Cable Modems Out of Service, which generates the same data.
Specify a name for the alarm template, e.g. Monitoring of absolute thresholds, and click OK.
Select the checkbox in the MON column for the parameter Cable Modems Out of Service.
Scroll to the far right of the alarm template to find the ANOMALIES column.
Click the button in the ANOMALIES column.
In the pop-up window, select Level increases.
Next to Level increases, select Absolute.
In the yellow box (i.e. major severity), fill in 50.
Click Close to close the window.
Click OK to save the alarm template.
Generate data for the element Anomaly Detection Tutorial - Cable Modems Out of Service 2:
Select the element in the Surveyor.
Click the Generate Data button to generate data for the parameter Cable Modems Out of Service.
Wait until the Data Generated? parameter displays Yes.
Click the trend icon
next to the parameter.You will see that now a major alarm was generated for all four upward jumps.
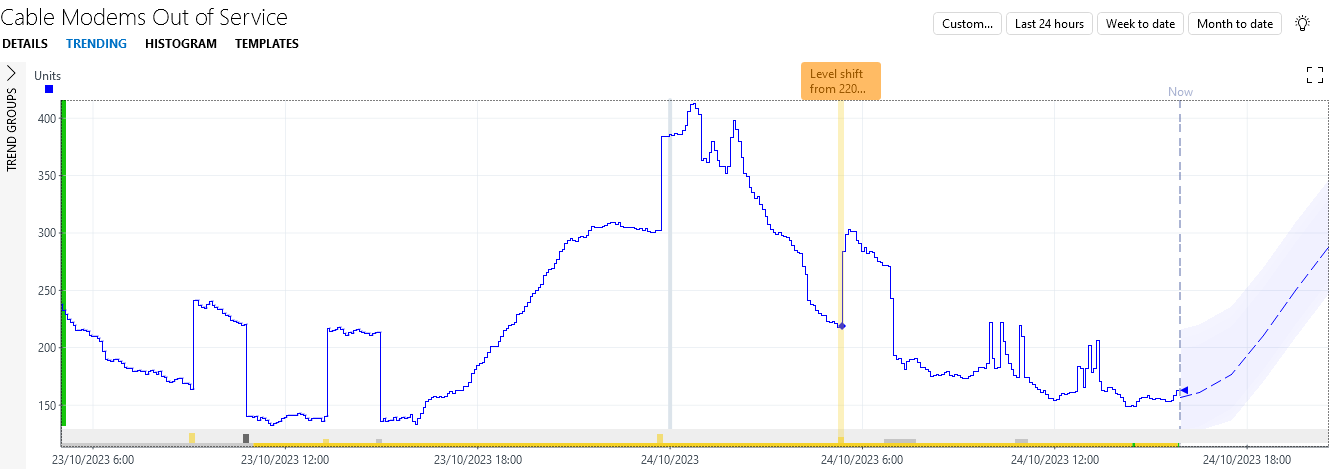
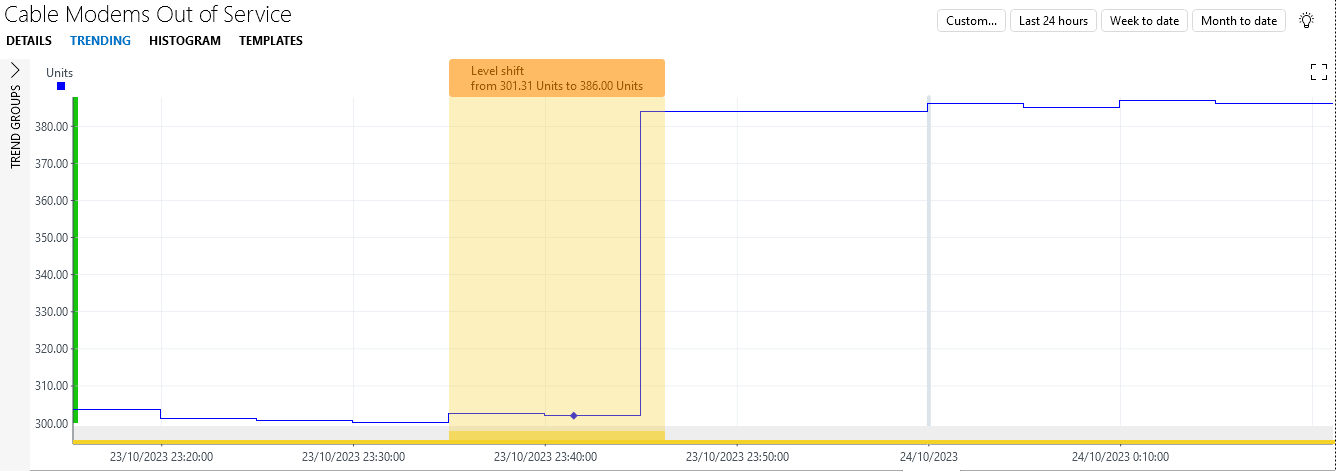
While this is already a great improvement, the third major alarm could be considered less severe than the other three, as a lot of other cable modems are already offline when the jump happens. When you hover the mouse pointer over the change point, you will see that the parameter jumps from around 300 to around 385 at that point, representing an increase of around 28%, while the first, second, and fourth jump represent increases of around 38%, 35%, and 33%, respectively. This means that the alarm monitoring could be further refined, so that only a minor alarm is generated for the third jump.
Configure Anomaly Detection Tutorial - Cable Modems Out of Service 3 with relative alarm thresholds for more refined monitoring:
Right-click the element Anomaly Detection Tutorial - Cable Modems Out of Service 3 in the Surveyor, and select Protocols & Templates > Assign alarm templates > New alarm template.
Specify a name for the alarm template, e.g. Monitoring of relative thresholds, and click OK.
Select the checkbox in the MON column for the parameter Cable Modems Out of Service.
Scroll to the far right of the alarm template to find the ANOMALIES column.
Click the button in the ANOMALIES column.
In the pop-up window, select Level increases.
Next to Level increases, select Relative.
Fill in 25 in the light-blue box (i.e. minor severity) and 30 in the yellow box (i.e. major severity).

Click Close to close the window.
Click OK to save the alarm template.
Generate data for the element Anomaly Detection Tutorial - Cable Modems Out of Service 3:
Select the element in the Surveyor.
Click the Generate Data button to generate data for the parameter Cable Modems Out of Service.
Wait until the Data Generated? parameter displays Yes.
Click the trend icon
next to the parameter.You should now indeed see major alarms for the first, second, and fourth jump, and a minor alarm for the third jump.
Tip
In exactly the same way, you can configure alarm monitoring of outlier anomalies. See Configuring Augmented Operations alarm settings.
Step 7: Final exercise
In this final step, you will apply everything you have learned earlier in a practical exercise:
Use the element Anomaly Detection Tutorial - Signal Strength. This element contains a parameter representing the strength of a signal received by a satellite dish.
Configure an alarm template for this element so that alarms are generated when something goes wrong. You will need to make sure that not too many alarms get created.
Here is a screenshot of what the trend graph for the Signal Strength parameter should look like when everything has been configured correctly:
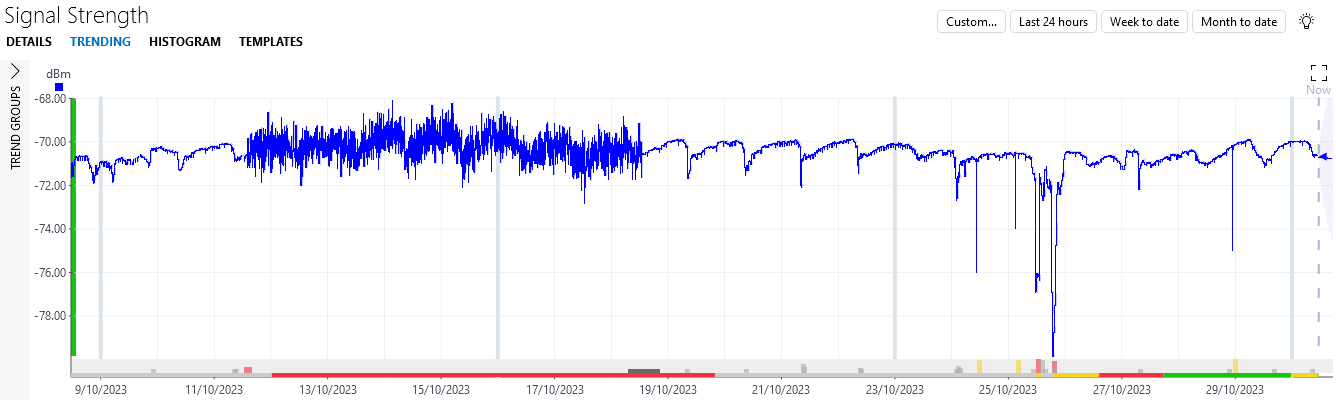
You can see the following notable things in the data illustrated above:
- A period of about a week with higher fluctuations than normal (starting at October 11th).
- Three short drops (on October 24th, October 25th, and October 29th).
- Two longer drops (on October 25th).
Based on what you have learned in the previous steps, you should now configure the alarm template so that the following alarms are generated:
- A major alarm for all three shorter drops.
- A critical alarm for both longer drops.
- A critical alarm at the start of the period with higher fluctuations.
Make sure that no extra alarms are generated, for example for the following things:
- The moment the higher fluctuations stop.
- Any other drops than indicated above.
Remember that you can always duplicate the element to try a second time, if you have not yet reached optimal results on a first attempt.
If you are a member of the DevOps Program and you have completed the exercise above, send us screenshots of the trend graph and your alarm template to get DevOps Points.
Use the following email format:
- Subject: Tutorial - Anomalies tutorial
- To: ai@skyline.be
- Body:
- Dojo account: Clearly mention the email address you use to sign into your Dojo account, especially if you are using a different email address to send this email
- Feedback (optionally): We value your feedback! Please share any thoughts or suggestions regarding this tutorial or the anomaly detection feature.
- Attachment:
- A picture of the trend graph with the correct anomalies.
- A picture of the Anomaly Alarm Settings pop-up window in the alarm template editor, showing the settings you used to generate the requested alarms.
Skyline will review your submission. Upon successful validation, you will be awarded the appropriate DevOps Points as a token of your accomplishment.
Important
We want to keep improving our Behavioral Anomaly Detection features, and your feedback is very helpful for this. That is why you can also earn DevOps Points by sending us good examples of detected anomalies and/or situations where the anomaly detection can be improved (e.g. no anomaly was detected, or an anomaly was detected for something that is not problematic).
Use the following email format to send us your examples:
- Subject: Tutorial - Anomaly detection feedback
- To: ai@skyline.be
- Body:
- Dojo account: Clearly mention the email address you use to sign into your Dojo account, especially if you are using a different email address to send this email.
- Feedback: Provide a short explanation of what is shown in the examples you are sending us and why the detected anomaly is good or bad.
- Attachment:
- A picture of the trend graph with the detected anomaly.
- An export of your trend graph, obtained by right-clicking the trend graph and selecting Export to CSV.
Skyline will review your submission. Upon successful validation, you will be awarded the appropriate DevOps Points.