Working with behavioral anomaly detection
Note
This feature requires Storage as a Service (recommended) or a self-managed Cassandra-compatible database.

DataMiner Analytics can detect the changes in the behavior of a trend, also known as "change points".
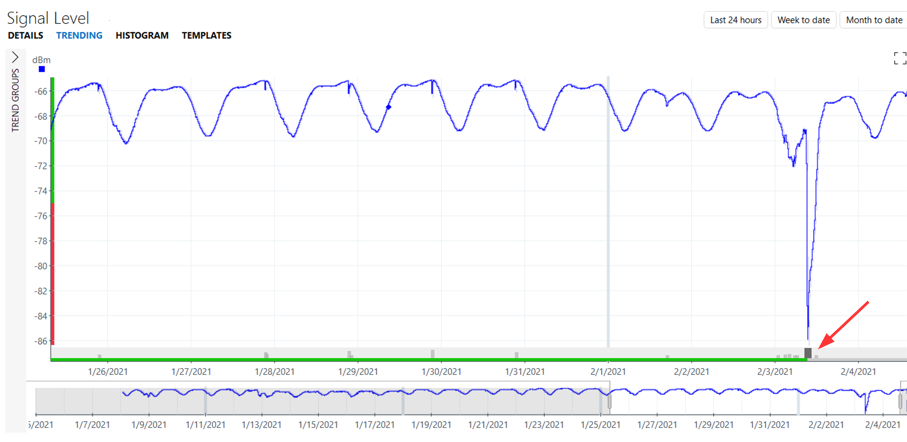
Trending: Anomaly detection in DataMiner 10.4.5
The following kinds of change points can be detected:
Flatline: A fluctuating value suddenly remains constant. This type of change point can be detected from DataMiner 10.2.5/10.3.0 onwards.
Level shift: A value shifts upwards or downwards and then stays at that level, e.g. a value fluctuating around 0 that starts to fluctuate around 10.
Outlier: A value suddenly spikes upwards or downwards, but returns to its previous, normal behavior after a few points.
Trend change: A value suddenly starts to increase or decrease at an unusual rate. For example, a value fluctuating around 10 (i.e. a trend slope of 0) that suddenly starts to increase by 1 unit per second (i.e. a trend slope of 1).
Variance change: The variance of a value either increases or decreases. For example, a series like 0.5, 0.6, -0.5, -0.2, 1, …, 5, 8, 9, -5, -6, -2.1, … indicates a variance increase. The value is first fluctuating around 0 between 1 and -1 and then starts fluctuating around 0 between 10 and -10.
Unlabeled change: If a change point cannot be classified as one of the above-mentioned change points, it is considered an unlabeled change.
If a change point other than an outlier or unlabeled change is unexpected, it will be considered anomalous. Level shifts that have a different direction than previous recent jumps or that jump to a previously unseen level will typically be labeled “anomalous”. Similarly, trend or variance changes will be labeled “anomalous” when no earlier trend or variance changes in the same direction were detected during the last weeks. A flatline will be considered anomalous when no recent flatline change point of approximately the same length or longer is detected.
From DataMiner 10.3.8/10.4.0 onwards, a change can also be considered anomalous if it has been seen before in the historical behavior of the parameter, but it does not fit in the usual periodic pattern.
Please note the following information regarding this feature:
Whenever an anomalous change point is detected, a suggestion event is generated, which is cleared again two hours after its creation time or its last update time. You can view these suggestion events by creating a suggestion event tab in the Alarm Console. See Adding and removing alarm tabs in the Alarm Console.
From DataMiner 10.4.11/10.5.0 onwards, you can provide feedback on suggestion events and alarms generated by behavioral anomaly detection. Based on this feedback, DataMiner will gradually learn when to trigger a suggestion event or an alarm.
You can configure alarm templates to have alarms generated instead of suggestion events, depending on the parameter and the type of anomaly. See Configuring Augmented Operations alarm settings.
If a very high number of behavioral change points are detected in a short period, detection of behavioral anomalies is temporarily disabled to avoid unreliable results. This is indicated in the SLAnalytics logging. Prior to DataMiner 10.2.3/10.3.0, a notification is also displayed in the Alarm Console, which disappears again 2 hours after the change point flood has been resolved.
From DataMiner 10.3.0 [CU9]/10.3.12 onwards, a change in trend must maintain its altered state for at least an hour before it is labeled as a trend change.
By default, anomaly detection is only available for numeric parameters that are not part of partial tables. It is also limited to at most 100,000 parameters per DMA. Prior to DataMiner 10.4.8/10.5.0, flatline detection is available for all numeric parameters, even if they are part of partial tables.
Anomaly detection is not available for discrete parameters.
Recent change points will be reflected in a parameter's trend icon. For a list of all available trend icons, see Working with trend icons.
Change points in trend graphs
On a trend graph, a change point is indicated by a bar below the graph. The length of the bar indicates the approximate time frame in which the change started, the height of the bar indicates the importance of the change, and the color of the bar indicates the severity. From DataMiner 10.4.1/10.5.0 onwards, the color is typically light gray, unless the change point was severe enough to trigger an event. Then, in case alarm monitoring is activated for change points, the color reflects the severity of the triggered alarm. In case alarm monitoring is not activated, the color is dark gray.
When you hover the mouse pointer over a change point bar, a semi-transparent ribbon will be displayed over the entire height of the trend graph, showing more information about the change point.
Labels of change points of type “trend change” will indicate the level of increase or decrease in seconds, minutes, hours or days depending on the value. If, for example, the value increases by 0.01 per second (i.e. 0.6 per minute, 36 per hour or 864 per day), the label will show an increase of 36 per hour as it is the smallest amount greater than 1.
Behavioral anomaly detection configuration in System Center
In DataMiner Cube, you can configure this feature in System Center, via System Center > System settings > analytics config > Behavioral anomaly detection. The following settings are available there:
Enabled: Allows you to activate or deactivate this feature.
Run on trended parameters by default: Available from DataMiner 10.4.8/10.5.0 onwards. If this option is enabled (default setting), behavioral anomaly detection is enabled by default for trended numeric parameters that are not part of partial tables, but you can override this setting for specific parameters in a trend template. If this option is disabled, behavioral anomaly detection is disabled system-wide, except for trended parameters of which the Anomalies setting has explicitly been enabled in the trend template. See Configuring trend templates.
Note
If behavioral anomaly detection is not enabled for a parameter, that parameter will not be included in the trend graph insights generated by relation learning.