Alarm Console settings
To access specific settings for the Alarm Console, click the hamburger button in the top-left corner of the console.
This will open a menu containing the settings explained below.
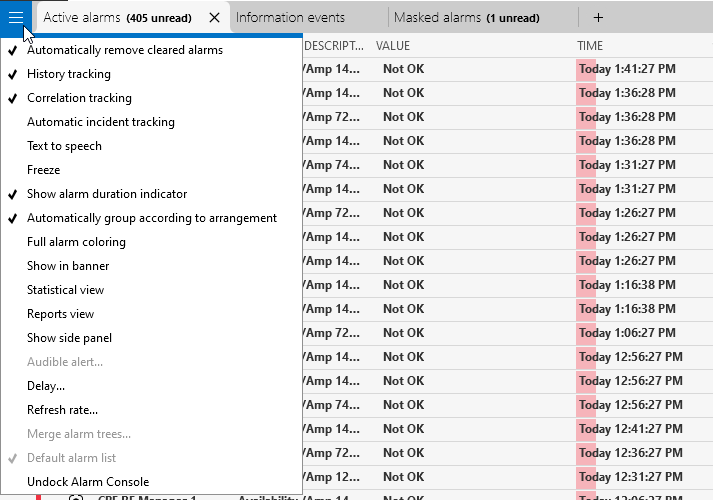
Alarm Console settings menu in DataMiner 10.3.6
Automatically remove cleared alarms
Select this option to remove alarms from the console automatically as soon as their severity returns to normal. To ensure alarms stay in the console until cleared by the user, clear the selection.
From DataMiner 10.2.0 [CU22]/10.3.0 [CU11]/10.4.2 onwards, this option is enabled by default for all alarm tabs listing active alarms and suggestion events, except for alarm tabs listing historical alarms or information events. Prior to DataMiner 10.2.0 [CU22]/10.3.0 [CU11]/10.4.2, this option is only enabled by default for alarms tabs listing active alarms.
Tip
See also: Clearing alarms
History tracking
Select this option to attach the life cycle of an alarm to the alarm. This means that all the alarms records related to the same alarm are grouped under one "alarm tree" entry in the Alarm Console. You can then expand this alarm tree to see all the underlying alarm records.
To show the alarm history as separate alarm records in the list instead, clear the selection.
In the active alarms tab, history tracking is enabled by default. In a history alarms tab, it is disabled by default, so that you can see the individual records more easily. When you create a filtered history tab in a fixed or sliding window, and you enable history tracking, you will be asked what should be loaded in the tab:
- Click All to include all alarms in the specified time range in the alarm trees, regardless of the filter.
- Click Filtered to only include alarms matching the current filter settings.
Tip
- For more information on creating filtered tabs, see Manually applying an alarm filter in an Alarm Console tab.
- For information on how alarm records are combined in an alarm tree, see Alarm trees.
Note
By default, a maximum of 20 alarms can be included in an alarm tree. This default number can be customized with the AlarmsPerParameter tag in MaintenanceSettings.xml.
Correlation tracking
Select this option to hide raw alarms of a correlated alarm. To show the raw alarms as separate alarm records in the list, clear the selection. If this option is selected, you can expand an alarm in the Alarm Console to view all attached alarm records.
Note
In case a filter is applied in the alarm tab, the behavior of this feature is different depending on the type of filter:
- If a filtered alarm tab is created (e.g. by dragging an item onto the Alarm Console or by selecting Apply filter in a new tab):
- If only the base alarm matches the filter, only that alarm is displayed.
- If only the correlated alarm matches the filter, only that alarm is displayed.
- If both base and correlated alarm match the filter, only the correlated alarm is displayed.
- If neither base nor correlated alarm match the filter, neither are displayed.
- If a quick filter is applied with the filter box in the lower right corner, the behavior is similar, except in case both base alarm and correlated alarm match the filter, as then both alarms will be displayed.
Automatic incident tracking
This option is only available in a DMS using Cassandra, and only if automatic incident tracking is enabled in System Center. It is also only available for active alarms, not for history alarms. For more information, see Automatic incident tracking.
Text to speech
Select this option to enable text to speech, so that new alarm events are read out loud.
Freeze
Select this option to stop displaying new incoming events in the currently selected alarm tab. Other open alarm tabs will not be frozen.
Note
While the alarm tab is frozen, any incoming alarms are kept in a buffer. However, if the buffer should reach more than 10,000 alarms, the Alarm Console will automatically no longer be frozen.
Show alarm duration indicator
Select this option to show a progress bar in the alarm severity color, indicating how long the alarm has been active in the DMS.
Automatically group according to arrangement
Select this option to enable automatic grouping by the column header used to sort the alarm list.
Full alarm coloring
Select this option to give all alarm records a background color indicating the current alarm severity.
Show in banner
Select this option to display a banner at the top of the Cube window when new alarms enter the tab. The banner shows the number of new alarms, the color of the most severe among them, and service impact information. By default, a sound is played whenever the alarm banner is shown or updated. When you click the banner, the Alarm Console tab will open and the new alarm(s) will be selected.

Banner in header bar displaying incoming alarms in DataMiner 10.4.5
Note
- It is possible to set a delay timer on when the alarm banner hides. For more information, see User settings.
- From DataMiner 10.4.0 [CU12]/10.5.0/10.5.3 onwards, it is possible to disable the sound that plays when the alarm banner is shown or updated. For more information, see Alarm Console settings.
Statistical view
Select this option to view the alarms in the alarm tab as statistics. For more information, see Using the statistical view.
Reports view
This option is only available in a DMS using Cassandra. Select to view severity timelines per element or per parameter. For more information, see Using the reports view.
Show side panel
Select this option to show the collapsible side panel in the Alarm Console.
Audible alert
Select this option to specify a custom alert sound that should be used when a new alarm enters the alarm tab. See Configuring a custom alert sound for an alarm tab.
Delay
Select this option to specify a delay between the creation of a new alarm and its appearance in the selected alarm tab.
E.g. if you set the delay to 30 seconds, when an alarm enters the Alarm Console, it will only be added to the list 30 seconds later. If in this interval the alarm has already been cleared, it will not be added to the list at all.
Tip
See also: Alarm Console – Delay & refresh rate of alarms on DataMiner Dojo 
Refresh rate
Select this option to specify how frequently the selected tab will be refreshed. This rate will be applied from the moment this setting is set.
E.g. if you set the refresh rate to 30 seconds at 11:48:00, the Alarm Console will be updated every 30 seconds with all the alarms that entered during those 30 seconds. The first refresh will take place at 11:48:30, the next at 11:49:00, etc.
Tip
See also: Alarm Console – Delay & refresh rate of alarms on DataMiner Dojo
Merge alarm trees
This setting is only available if History tracking is enabled and Automatically remove cleared alarms and Freeze are disabled in the alarm tab.
When these settings are used, by default, when an alarm is cleared and then reappears, this results in a separate alarm tree. Activating Merge alarm trees combines these alarm trees, which can result in a better overview, e.g. in a sliding window tab.
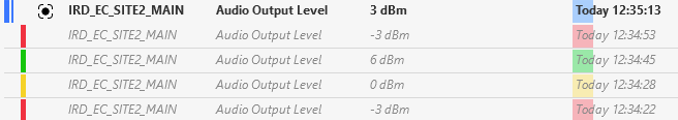
Merged alarm trees in DataMiner 10.4.5
When you activate this option, you can also select an additional option to only merge alarm trees in case the time between the alarm trees is less than a particular time span (between 1 second and 1 day).
Default alarm list
Select this option to make the currently selected tab the default tab, i.e. the tab that will be shown when you open DataMiner Cube. If the selected tab is already the default tab, this option will be unavailable.
Note
To display Alarm Console group statistics, to display a horizontal scrollbar in the alarm list, or to configure the Alarm Console, refer to the general settings in Cube instead. See User settings.