Changing the layout of the Alarm Console
The three default alarm tabs
By default, the Alarm Console contains the following tabs:
Active alarms: All active alarm records, except information messages and masked alarms.
Note
If the Active alarms tab is selected, a history slider button is available in the alarm bar that can be used to show alarms active at a certain time in the past. See Working with the Alarm Console history slider.
Information events: All information messages, such as a user logging in, changing an alarm template or deleting an element, a script being executed, etc.
Masked alarms: Masked alarms are automatically moved from the active alarms tab to the masked alarms tab. When unmasked, the alarms move back to the active alarms tab. See Masking and unmasking alarms.
Note
It is possible to set different default tabs in the user settings and group settings. See Setting the default alarm tabs and columns in the Cube settings.
Adding and removing alarm tabs in the Alarm Console
In the Alarm Console, you can add and remove tabs as you see fit. However, this custom layout is only saved across sessions for tabs displaying active alarms or alarms in a sliding window, not for alarm history tabs.
Note
- If the Alarm Console contains more tabs than can be displayed on the screen, a "..." icon will be displayed. To open one of the tabs that are not displayed, click this icon, and select the tab from the drop-down list.
- For embedded Alarm Consoles displayed on the ALARMS page of cards, custom tabs are only saved if you select to Apply filters, and then select the Show this tabpage checkbox before clicking Show alarms.
Adding a tab
Click the + symbol in the header of the Alarm Console.
Choose which alarms should be shown in the tab.
There are many options to choose from, such as:
Reopen closed alarm lists: Lists any alarm tabs you have recently closed. Note that it is possible to pin items in this list using the pin icons, so that these are then always displayed at the top of the list.
Show current >Active alarms: Displays the default Active alarms tab.
Show current > Active alarms linked to cards: With this option, if you select an item in the Surveyor or on a card, the tab will automatically switch to the alarms for this item.
Show current > My active alarms: Shows active alarms of which you are the owner.
Show current > Unassigned active alarms: Show active alarms that do not have an owner yet.
Show current > Information events: Displays the Information events tab.
Show current > Suggestion events: Displays the Suggestion events tab. Suggestion events are AI-generated notifications. See Advanced analytics features in the Alarm Console.
Note
This tab is only available in DataMiner Systems using Storage as a Service (recommended) or a self-managed Cassandra-compatible database. In addition, the necessary analytics features need to be enabled via System Center > System settings > Analytics Config:
- From DataMiner 10.3.0 [CU15]/10.4.0 [CU3]/10.4.6 onwards, Behavioral Anomaly Detection, Pattern Matching, or Proactive Cap Detection need to be enabled.
- Prior to DataMiner 10.3.0 [CU15]/10.4.0 [CU3]/10.4.6, Behavioral Anomaly Detection must be enabled.
Show current > Masked alarms: Displays the Masked alarms tab.
Show history: Lists history tabs for the past hour, day, week, month, etc.
Show alarms in a sliding window: Displays the alarms that have occurred in a certain time frame that moves along with the present time. You can set the size of the sliding window to a minimum of one minute and a maximum of 1440 minutes.
Note
- In tabs set to a sliding window, only alarms raised within this window are shown. As a consequence, if you turn off history tracking or correlation tracking, history alarms and correlation source alarms will only be shown if they were raised within the sliding window.
- Refresh rate and delay cannot be set in sliding window alarm tabs.
- You can select the option Keep active alarms along with the option to show alarms in a sliding window. When you do so, active alarms will remain displayed in the tab even if they no longer fall in the sliding window.
Include alarms / Include masked alarms / Include information events / Include suggestion events: Select or clear these checkboxes to determine the type of alarms that will be displayed in the new tab. This allows you to for example display a tab with information events only.
Note
- The Include suggestion events checkbox is only available in DataMiner Systems using Storage as a Service (recommended) or a self-managed Cassandra-compatible database. Suggestion events are notifications generated by the advanced AI-based analytics functionality. See Advanced analytics features in the Alarm Console.
- From DataMiner 10.3.10/10.4.0 onwards, the Include masked alarms option is no longer available for history tabs. When you select the Include alarms checkbox, masked alarms are automatically included.
Apply filters or Apply filter and window size: Shows alarms filtered by a custom filter.
Note
For more information on filtering alarms, see Manually applying an alarm filter in an Alarm Console tab.
Changing the name of a tab
Right-click the tab header and select Change tab name.
Fill in the new name and press Enter.
Removing a tab
Click the tab header to select the tab.
Click the X to the right of the name of the tab.
Note
When you have created a history, sliding window, or filtered active alarms tab, you can edit it afterwards by clicking the pencil icon next to the tab name. For a history or sliding window alarms tab you can for example change the applied filter and time range, and for a filtered active alarms tab, you can change the applied filter.
Changing the column layout in an alarm tab
The list of alarms in an Alarm Console tab can be manipulated in several ways.
Tip
See also: Alarm Console – Adding columns to the Alarm Console on DataMiner Dojo 
Sorting and grouping columns
To sort the alarms by a particular field:
Click a column header. Click it again to reverse the sort order.
Note
- By default, alarms are sorted by timestamp (with the most recent alarm on top).
- If you are using the keyboard to navigate the Cube interface, to sort by a particular field, press Enter when the keyboard focus is on the header of that column. See Using keyboard navigation.
By default, the Alarm Console is set to group alarms automatically according to whatever column is selected. However, it is also possible to group by a particular field, and then do further changes to the sort order or further grouping on other fields. To do so:
Click the hamburger button in the top-left corner and clear the selection from Automatically group according to arrangement.
Right-click the header you want to group by and select Group by this field.
Optionally, click other headers to change the sort order, or apply further grouping by repeating step 2 for different columns.
Note
When alarms have been grouped, you can select all alarms in a group by clicking the group header.
Moving and adjusting columns
To change the width of a column:
Drag the edges of the column header to the left or to the right.
Double-click an edge of a column header to adjust the column width to the contents of the column.
To move a column to another position:
- Click the column header and drag it to the new position.
Adding or removing columns
To add or remove columns:
Right-click in the table header, choose Add/Remove column, and select the columns you want to add or remove.
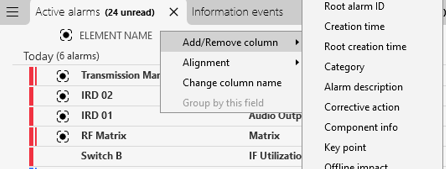
Adding or removing alarm columns in DataMiner 10.4.5
Note
It is possible to add action buttons in the Alarm Console with this functionality, by selecting the required actions under Add/Remove column > Actions.
Tip
See also: Alarm Console columns
Renaming a column
To rename a column:
- Right-click in the table header, and choose Change column name.
Changing the column alignment
To change the alignment of a column:
- Right-click in the table header, choose Alignment, and select Left, Right, or Center.
Restoring the default column layout
To return the columns to the default layout:
- Right-click in the table header, choose Add/Remove column, and select the option Set default columns (at the bottom of the list of columns in the context menu).
Note
User preferences such as column order and grouping are automatically saved in the DMS. So no matter where you log on to the DMS, your personal preferences will always be applied.
Setting the default alarm tabs and columns in the Cube settings
It is possible to create a different default layout for the Alarm Console, which is saved across sessions. This can be done both at group level and at user level.
Tip
See also: Rui’s Rapid Recap – Configuring the Alarm Console at group level on DataMiner Dojo
To do so:
Go to the user settings or group settings.
For more information on how to access these settings, see User settings or Configuring a set of user group settings.
Go to the Alarm Console page.
At the bottom of the page, in the Configure Alarm Console section, adapt the settings according to preference:
In the first column, select the Cube side for which you wish to configure the settings.
In the second column, use the right-click menu to add or remove tab pages for the Cube side selected in the first column. You can also change the tab names, or change the tab order by dragging and dropping a tab.
For each tab, in the third column, use the right-click menu to add or remove columns to be displayed in the Alarm Console.
At the bottom of the third column, set the default Alarm Console settings for the selected tab.
The same options are available as under the Alarm Console settings button, except the Freeze, Show in banner and Statistical view options. You can also set the RCA filter for the tab.
Tip
See also: Alarm Console settings
In the fourth column, for each column selected in the third column, change the column alignment and width if necessary.
Note
- Settings that are enforced at group level cannot be changed at user level.
- If you create new settings for a group, these will not by default contain the tabs Active Alarms, Information Events and Masked alarms.
Using the statistical view
To view the alarms in an alarm tab as statistics instead of in a regular list view, click the statistical view button in the alarm bar: 
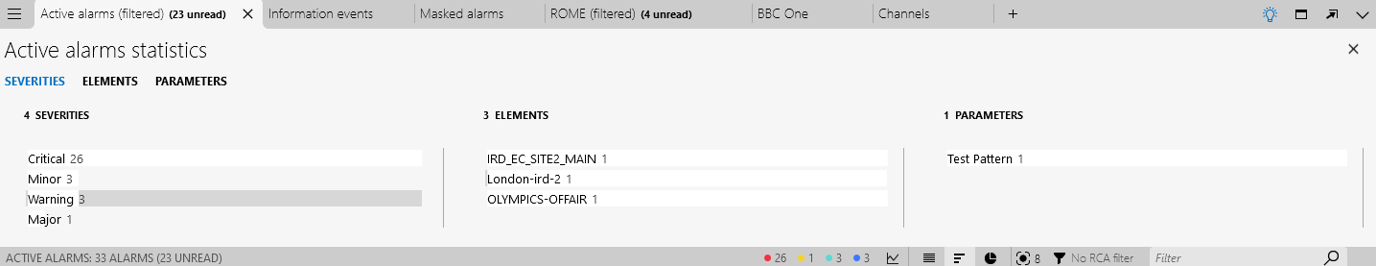
Statistical view in DataMiner 10.4.5
To return to the regular list view again, click the list view button: 
The statistical view has three tab pages, each offering a different drill-down approach:
| Tab page | Drill-down sequence |
|---|---|
| Severities | Severities > Elements > Parameters |
| Elements | Elements > Parameters > Severities |
| Parameters | Parameters > Elements > Severities |
Each list item is shown as a horizontal bar. The length of the bar indicates how many alarms the item represents.
If you double-click an item or right-click it and select Show alarms, the alarm tab shows the regular list view again, but with the appropriate filter applied.
Note
This setting is not remembered across user sessions. If you reconnect to DataMiner Cube, the alarm tab will show a regular list view again.
Using the reports view
To view severity timelines per element or per parameter:
Click the reports view button in the alarm bar:

Depending on whether you wish to see these so-called “heat maps” for elements or for parameters, either stay in the elements tab, or go to the parameters tab.
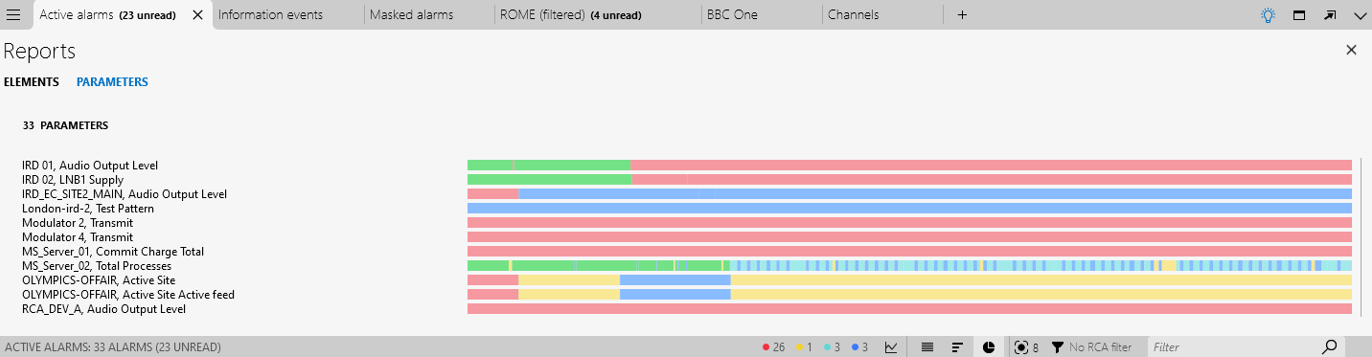
Reports view in DataMiner 10.4.5The tabs respectively list all elements and all parameters in the DMS for which an alarm has occurred, and for each item in the list, a timeline is displayed that shows the evolution of the alarm severity over time.
Double-clicking a heat map will open a card with more information:
For an element heat map, the relevant element card is opened.
For a parameter heat map, the parameter card is opened. If it is a trended parameter, the trending tab is displayed, otherwise the details tab is displayed.
To return to the regular list view again, click the list view button:

Note
This feature is only available in a DataMiner System using Storage as a Service (recommended) or a self-managed Cassandra-compatible database.