Enhancing your service monitoring
In this tutorial, you will learn how to enhance a television channel service to save time and simplify monitoring. You will improve an existing service using a service protocol, adding value to operations. Additionally, you will learn how to access service data from web apps.
The content and screenshots for this tutorial have been created using DataMiner 10.5.4.
Expected duration: 20 minutes.
Tip
See also: Kata #64: Enhancing your service monitoring on DataMiner Dojo  .
.
Prerequisites
- A DataMiner System that is connected to dataminer.services.
Overview
This tutorial consists of the following steps:
- Step 1: Deploy tutorial materials from the Catalog
- Step 2: Duplicate an existing service and include an extra managed object
- Step 3: Enhance your service with a service protocol
- Step 4: Configure an alarm template for the service
- Step 5: Visualize standard service data in a dashboard
- Step 6: Visualize enhanced service data in your dashboard
- Step 7: Visualize data for managed objects from a service perspective in your dashboard
Step 1: Deploy tutorial materials from the Catalog
Go to Providing a customer-centric system view with services in the Catalog.
Deploy the package to your DataMiner Agent by clicking the Deploy button.
Tip
See also: Deploying a Catalog item to your system
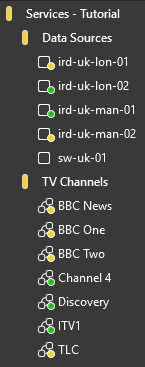
When the package has been fully deployed, you will see the following view structure in the Surveyor in DataMiner Cube:
Step 2: Duplicate an existing service and include an extra managed object
In the Cube Surveyor, under the TV Channels view, right-click the BBC News service and select Duplicate.
On the edit page, change the name to
BBC News Enhanced, and click Next.On the parameters page, select the ird-uk-lon-01 element and set the Alias field to
Site 1.Click Add element, add ird-uk-lon-02, and click OK.
Select the ird-uk-lon-02 element and configure the following details:
Set the alias to
Site 2.Clear the All parameters checkbox and select Audio Output Level.
Click Create.
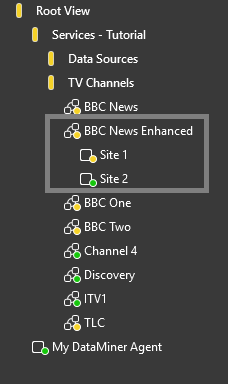
At this point, you should have a service that contains two sites. Take your time to explore the available content.
Step 3: Enhance your service with a service protocol
Right-click the BBC News Enhanced service and click Edit.
Expand the Advanced section and set Protocol to Enhanced Service Tutorial.
Click Apply.
You should now see that your service has been enhanced with additional data cards:
- General
- Alarms
- Elements
- General parameters
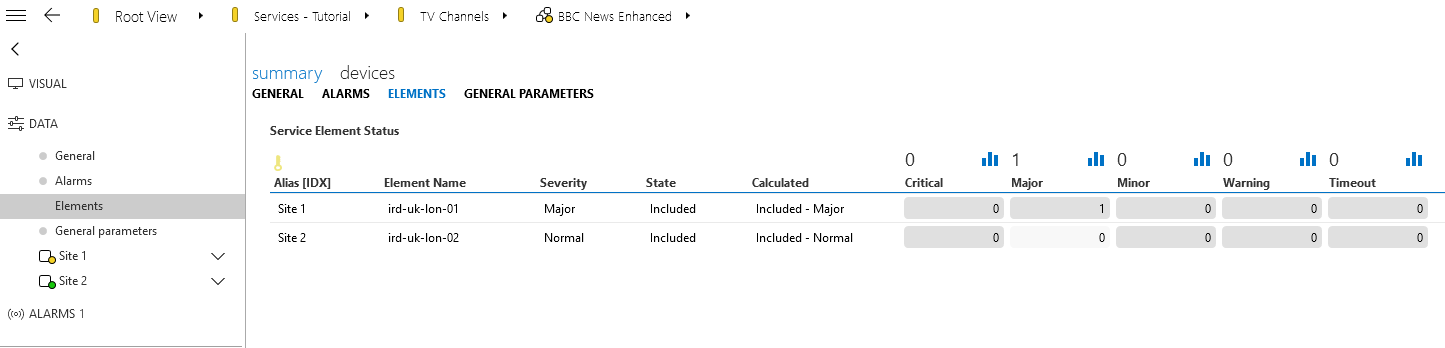
For example, the Elements card contains relevant information about the managed objects that are involved in the service, which is often used in centralized monitoring.
Note
If you intend to develop your own service protocol, we recommend using Skyline Service Definition Basic as your starting point. This connector already includes many of the standard features required to enhance a service.
Step 4: Configure an alarm template for the service
Right-click the BBC News Enhanced service in the Surveyor and select Protocols & Templates > View available templates.
This will open the Protocols & Templates module and immediately select the service protocol in the module.
In the Alarm section, right-click and select New to create a new alarm template for the service protocol.
This will open a pop-up window.
In the pop-up window, specify a name of your choice (e.g. Service Tutorial) and click OK.
Select Monitor Active Alarms and click Apply.
When prompted to link the new alarm template, click Yes.
Add the BBC News Enhanced service and click Close.
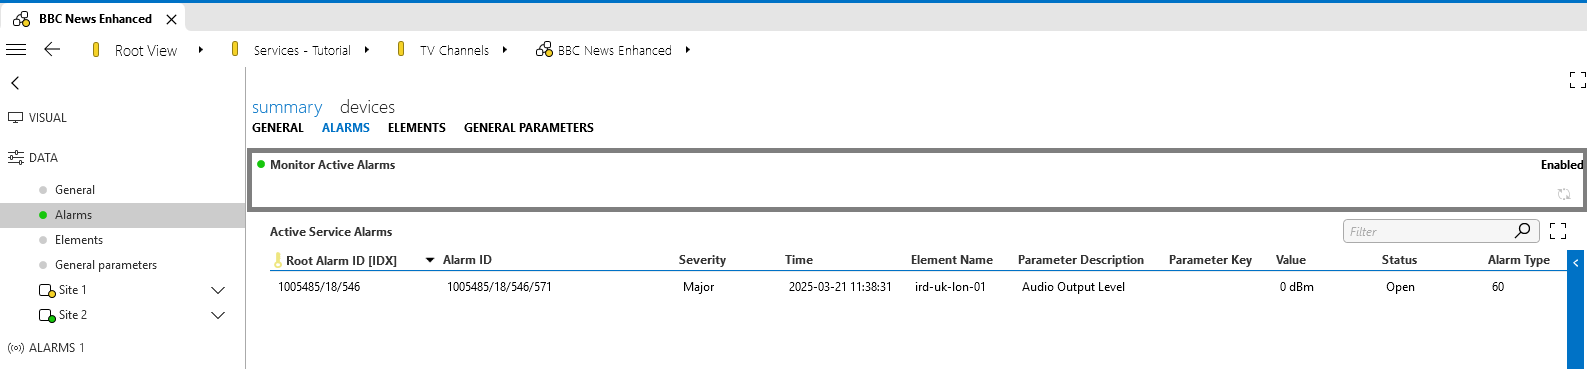
You should now see the Monitor Active Alarms parameter being monitored. Toggle the parameter to Enabled to see the alarms impacting the managed objects associated with the service.
In a similar way, you can also create trend templates and information templates to enrich the functionality of the enhanced service. In the same Protocols & Templates module, you can also add a custom Visio file to customize the visuals for your service.
Step 5: Visualize standard service data in a dashboard
Create a new dashboard:
In Cube, go to Apps > Web Apps and click Dashboards.
If you are not logged in yet, log in using the same credentials as for Cube.
In the Dashboards app, click on the ... button at the top of the pane on the left and select Create dashboard.
In the Name field, specify
Visualize service data, and click Create.You should now have an empty dashboard where you can add the service data.
In the Data pane on the right, expand Queries and click the + button to add a new query.
Configure your new query as follows:
Specify the name Get standard service.
Select the data source Get services.
Select the operator Select, and then select the columns Name and Alarm state.
Click the pencil icon at the top of the query to finish the configuration.
Drag the Get standard service query onto the dashboard.
In the component, click the button next to Pick a visualization and select the Table visualization.
Drag the edges of the component to adjust the table size until as much data as possible is shown.
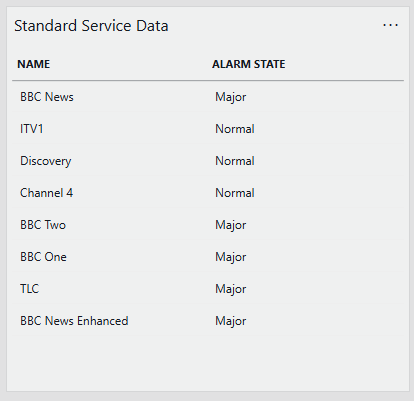
With the table selected, go to the Layout pane on the right, and set Title to
Standard Service Data.
You should now have a table displaying the name of all the services in your system and their respective alarm state.
 .
.
Step 6: Visualize enhanced service data in your dashboard
In the Data pane, click the + button below Queries to add another new query.
Configure your new query as follows:
Specify the name Get enhanced service.
Select the data source Get parameters for elements where.
Select the type Protocol > Enhanced Service Tutorial.
Select the parameter Service element status.
Add the operator Select.
Make sure the following columns are selected: Alias, Element Name, Severity, State, Critical, Major, Minor, Warning, Element ID, and Service Name.
Click the pencil icon at the top of the query to finish the configuration.
Drag the Get enhanced service query onto the dashboard.
Select the Table visualization like before.
Adjust the table size to fit the data to the best extent possible.
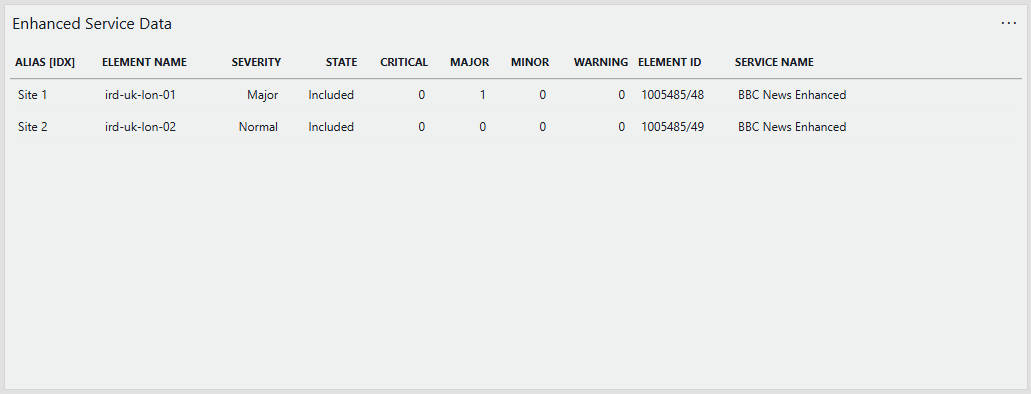
With the table selected, go to the Layout pane on the right, and set Title to
Enhanced Service Data.
You should now have a table displaying the information about the managed objects (i.e. elements) for the services in your system.
 .
.
Step 7: Visualize data for managed objects from a service perspective in your dashboard
In this final step, you will have the dashboard retrieve data directly from the managed objects included your enhanced services. This way you can use the dashboard for a service-focused monitoring approach.
Add another query and configure it as follows:
Specify the name Get managed-object data.
Select the data source Get parameters for elements where.
Select the type Protocol > Philips DVS3810.
Select the parameter Audio Output Level.
Add the operator Filter.
Select the column Element ID.
Select the filter method Regex.
Click the link icon next to the Value box.
In the Link to panel, configure the fields as follows and then click Link:
- Data: Table 2
- Type: Tables
- Property: Element ID
Click the pencil icon at the top of the query to finish the configuration.
Drag the Get managed-object data query onto the dashboard.
Select the Table visualization like before.
Adjust the table size to fit the data to the best extent possible.
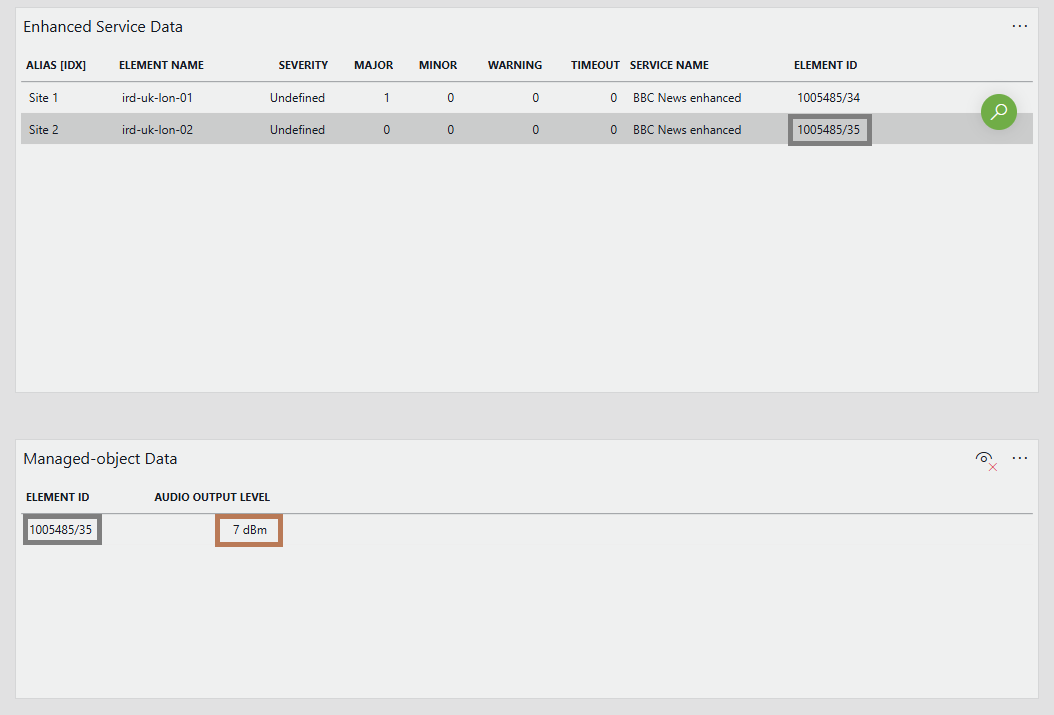
With the table selected, go to the Layout pane on the right, and set Title to
Managed-Object Data.
You should now have a table displaying the information from the managed objects of all the services in your system, with the ability to filter using a service-centric approach.
 .
.