Using Visual Overview to switch spectrum presets
This tutorial explains how to start from a blank Visio file and add a spectrum control and several buttons to switch between presets. As an example, a configuration will be used that represents a cable operator headend, where a channel is received from satellite, processed, and then transmitted over the cable network. In practice, this can be used for any processing chain of HF signals or to do measurements on different locations in the network.
Expected duration: 25 minutes
Prerequisites
- A DataMiner System that is connected to dataminer.services and where the connector Skyline Spectrum Simulator has been deployed.
- Microsoft Visio
Note
The content and screenshots for this tutorial were created using DataMiner version 10.4.10 and Microsoft Visio Standard 2016. If you use different software versions, you may encounter some differences.
Tip
- See also: Kata #40: Create a visual workflow for the spectrum analyzer on DataMiner Dojo

- For more information about the capabilities of the Skyline Spectrum Simulator connector, refer to the connector documentation Skyline Spectrum Simulation and the KATA video Kata #32: Using the spectrum analyzer.
Overview
- Step 1: Create a view
- Step 2: Create a spectrum simulation element
- Step 3: Add a blank Visio file to the view
- Step 4: Add a spectrum component shape
- Step 5: Create a preset to hide the info pane
- Step 6: Use the preset on the spectrum component
- Step 7: Create presets for the measurements
- Step 8: Use session variables to link the presets to buttons
- Step 9: Draw a graphic representation of the setup
- Step 10: Show only the current selection
Step 1: Create a view
Open DataMiner Cube and connect to your system.
Tip
If have you created a new DaaS system for this tutorial, refer to Accessing a newly created DMS for the first time for more information.
Right-click the root view and select New > View.
Give the view a name of your choice, e.g.
Visio spectrum presets.
Step 2: Create a spectrum simulation element
Right-click the view you have just created and select New > Element.
Configure the new element as follows:
- Name: Enter a name of your choice e.g.
Spectrum Simulation. - Protocol: Skyline Spectrum Simulator.
- Name: Enter a name of your choice e.g.
Click Create.
Tip
See also: Adding elements
Step 3: Add a blank Visio file to the view
Open the new view on the Visual page.
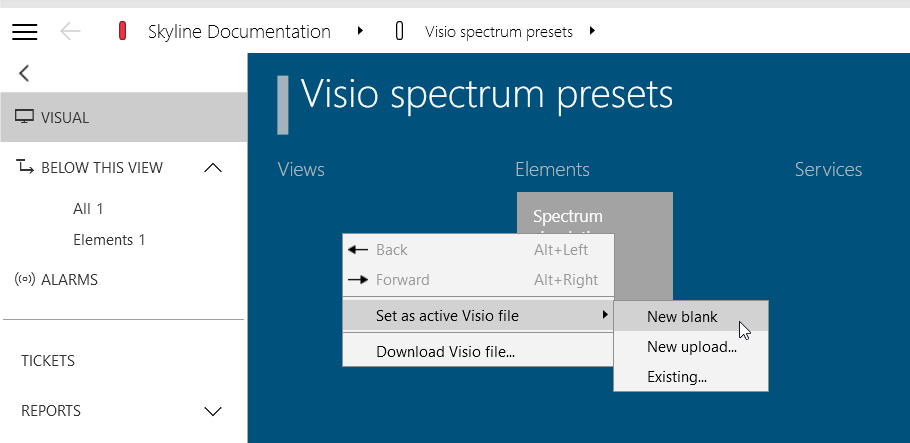
Right-click the Visual page, and select Set as active Visio file > New blank.
In the New Visio file pop-up window, click Yes.
At this point, your Microsoft Visio application should start up automatically, and you can start modifying your new Visio file.
Step 4: Add a spectrum component shape
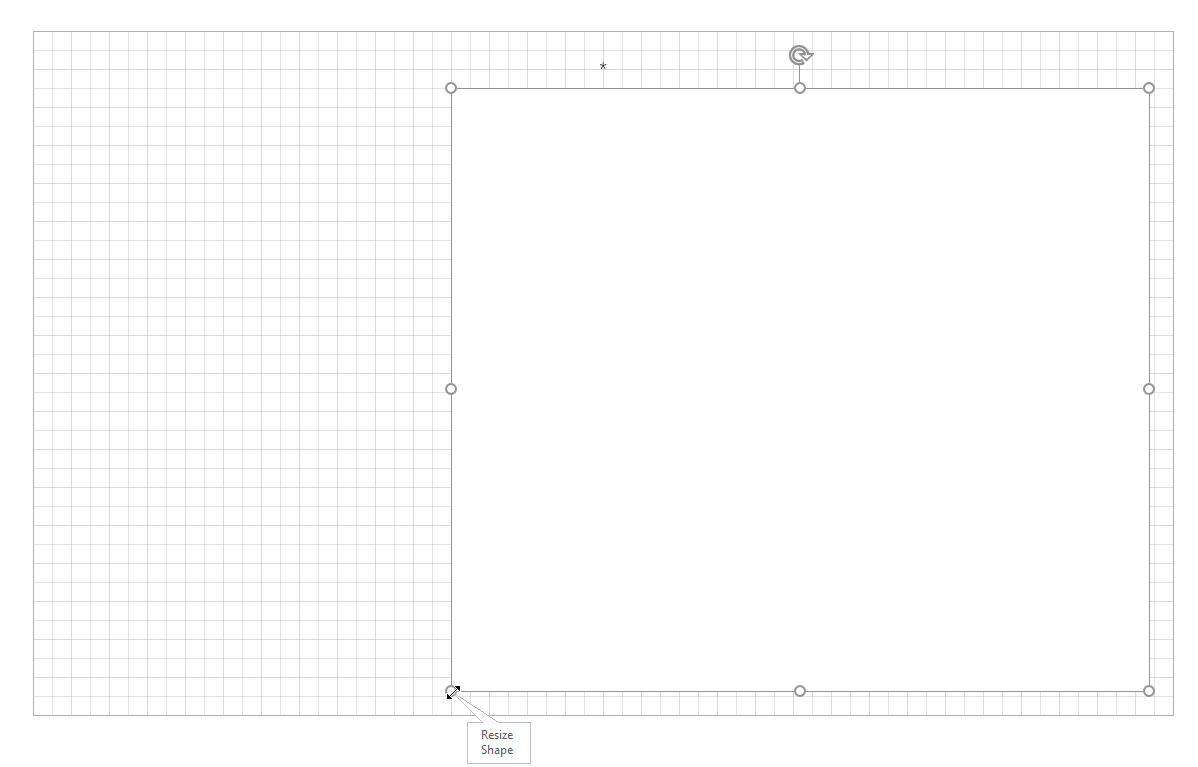
In the Visio drawing, select the grey rectangle and press Delete to remove the shape from the page.
You can leave the title shape in place.
In the Home tab of the ribbon, click the rectangle in the Tools section.
Draw a large rectangle on your page by clicking and dragging the mouse on it.
If the shape data pane is not yet open, right-click the rectangle shape and select Data > Shape Data.
By default, this will open the shape data pane as a pop-up window, but you can dock it to one of the sides of the Visio UI instead. This will be handy, as you will need this pane often when editing Visio files for use in DataMiner.
Right-click the shape data pane and select Define Shape Data.
In the pop-up window, set the Label field to
Elementand the Value field to the name of the spectrum simulation element you created earlier, e.g.Spectrum Simulation.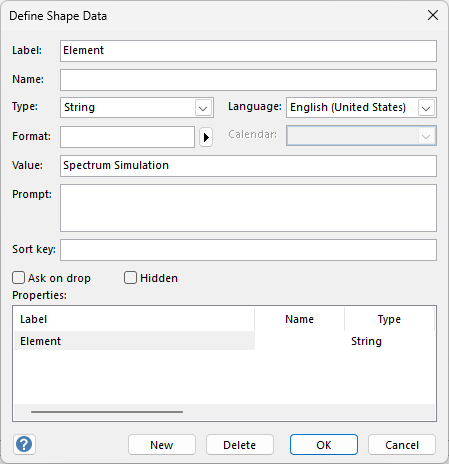
Click the New button to add another shape data field with label
Componentand valueSpectrum.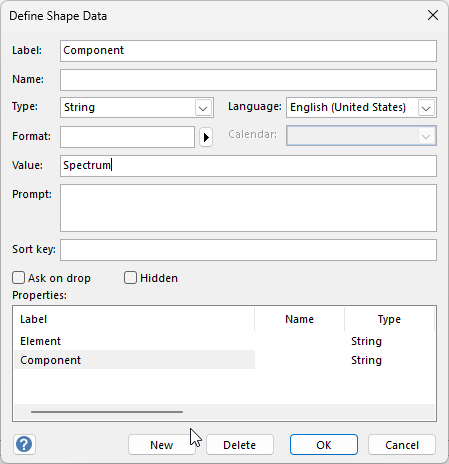
Click OK to close the Define Shape Data window.
Make sure no more shapes are selected.
Save the Visio file.
Check the Visual page in DataMiner Cube.
The page should now contain a basic spectrum control, with all the features of the spectrum control in the element, but without the ribbon. This control will also display the info pane. In the next step, you will learn how you can keep this from being shown.
Step 5: Create a preset to hide the info pane
In DataMiner Cube, navigate to the Spectrum Analyzer data page of your spectrum simulation element.
In the View tab of the ribbon, click the Info pane button to hide the info pane.
In the spectrum sidebar on the right, select the Presets tab and click the Manage button at the bottom.
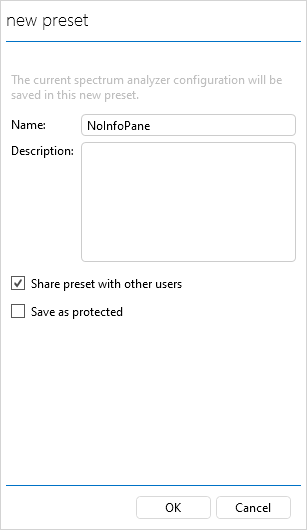
Click the New button.
Configure the preset:
Give the preset the name
NoInfoPane.Select the Share preset with other users checkbox.
Click OK.
Click OK again to close the Manage presets pane.
Step 6: Use the preset on the spectrum component
In DataMiner Cube, navigate back to the Visio spectrum presets view.
Go back to the Visio file you were working on earlier.
If you have already closed the Visio file, re-open it by right-clicking the Visual page on the view card and selecting Edit in Visio.
Select the rectangular shape that you linked to the spectrum component.
Right-click the shape data pane and select Define Shape Data.
Click New to add another shape data field.
Configure the new shape data field with the label
ComponentOptionsand the valuepreset=NoInfoPane (public), and click OK.The
(public)suffix is needed to indicate that this is a shared preset.Make sure no more shapes are selected.
Save the Visio file.
Check the Visual page in DataMiner Cube.
You will see that in DataMiner Cube, the spectrum control no longer includes the info pane.
Step 7: Create presets for the measurements
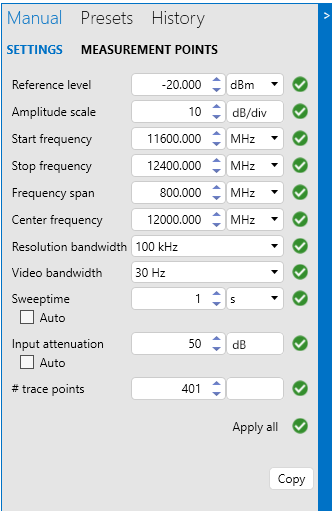
In this step, you will create additional presets for each of the center frequencies from which the frequency spectrum should be retrieved.
In DataMiner Cube, navigate to the Spectrum Analyzer data page of your spectrum simulation element.
In the Manual tab of the spectrum sidebar, change the settings to the desired values. e.g. for a satellite signal this could be a 12GHz center frequency and a 800MHz frequency span. For this tutorial, you can leave the other settings as they are.
- Center frequency
12GHz. - Frequency Span
800MHz.
- Center frequency
In the spectrum sidebar, select the Presets tab and click the Manage button at the bottom.
Click the New button.
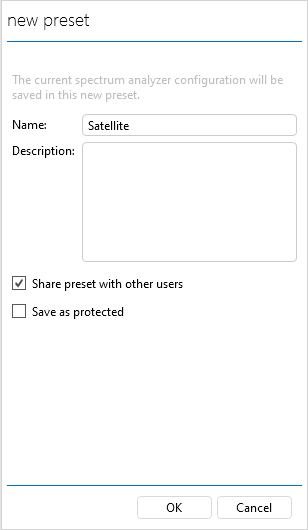
Configure the preset:
Give the preset the name
Satellite.Select the Share preset with other users checkbox.
Click OK.
Click OK again to close the Manage presets pane.
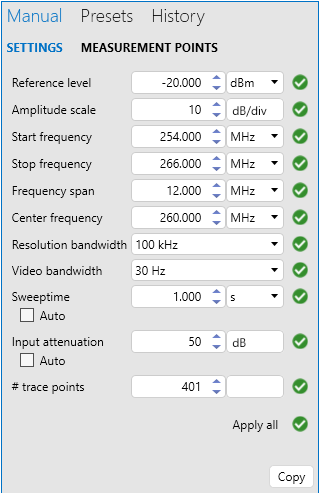
Repeat the steps above for a second signal. E.g. For a cable signal, we could use a center frequency of 260 MHz and a frequency span of 12 MHz. Give it the name
Cable.- Center frequency
260MHz. - Frequency Span
12MHz.
- Center frequency
Step 8: Use session variables to link the presets to buttons
In this step, you will use session variables and placeholders to link buttons to the presets. Session variables are small pieces of data that are kept in DataMiner Cube memory for as long as the Cube session is active.
In DataMiner Cube, navigate back to the Visio spectrum presets view.
Go back to the Visio file you were working on earlier.
If you have already closed the Visio file, re-open it by right-clicking the Visual page on the view card and selecting Edit in Visio.
Resize the shape linked to the spectrum analyzer control to make room for buttons.
Create a small rectangular shape, and add the text
Switch to Satellitein the shape.Add a shape data field to this shape, with label
SetVarand valuevarPreset:Satellite (public).In this value,
varPresetis the name of the session variable, andSatellite (public)refers to the name of the spectrum preset. The(public)suffix is needed to indicate that this is a shared preset.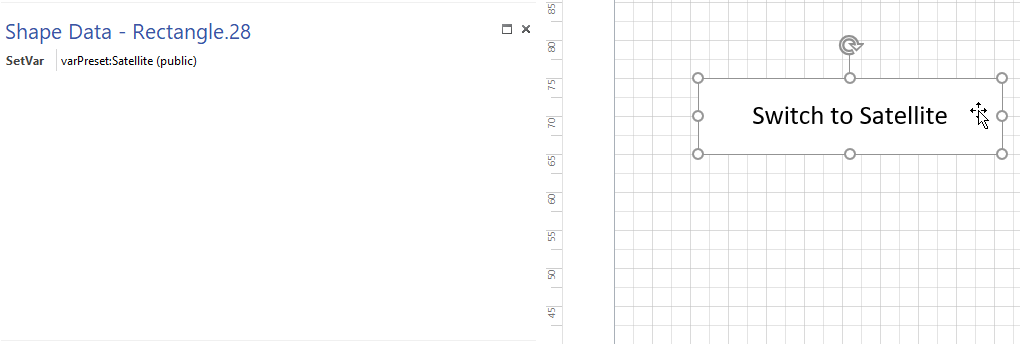
Duplicate this shape by using copy/paste and change the text and shape data of the copy so it refers to the
Cablepreset.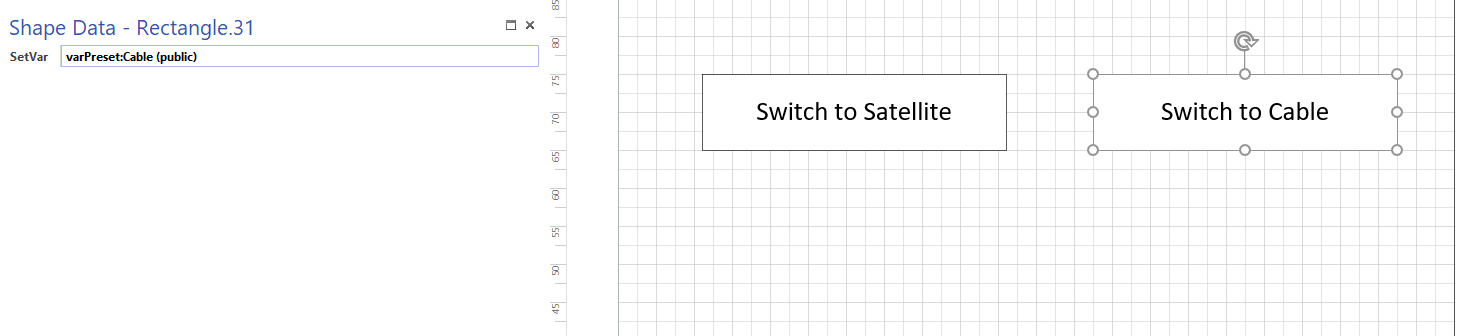
In the spectrum component shape, replace the fixed preset reference by a session variable placeholder:
Select the spectrum component shape.
In the (docked) shape data window, replace the value for the ComponentOptions label. Instead of
preset=NoInfoPane (public)to link to a fixed preset, specifypreset=[var:varPreset].The value between square brackets is a placeholder and will be replaced by the value it refers to.
var:indicates that the placeholder should be replaced with the value of a session variable;varPresetindicates the name of the session variable.
Tip
For more information on the use of placeholders in shape data, see Placeholders for variables in shape data values
Make sure no more shapes are selected.
Save the Visio file.
On the Visual page in DataMiner Cube, click the buttons and verify whether the presets are correctly changed.
It may take a few seconds before the presets are fully switched.
Step 9: Draw a graphic representation of the setup
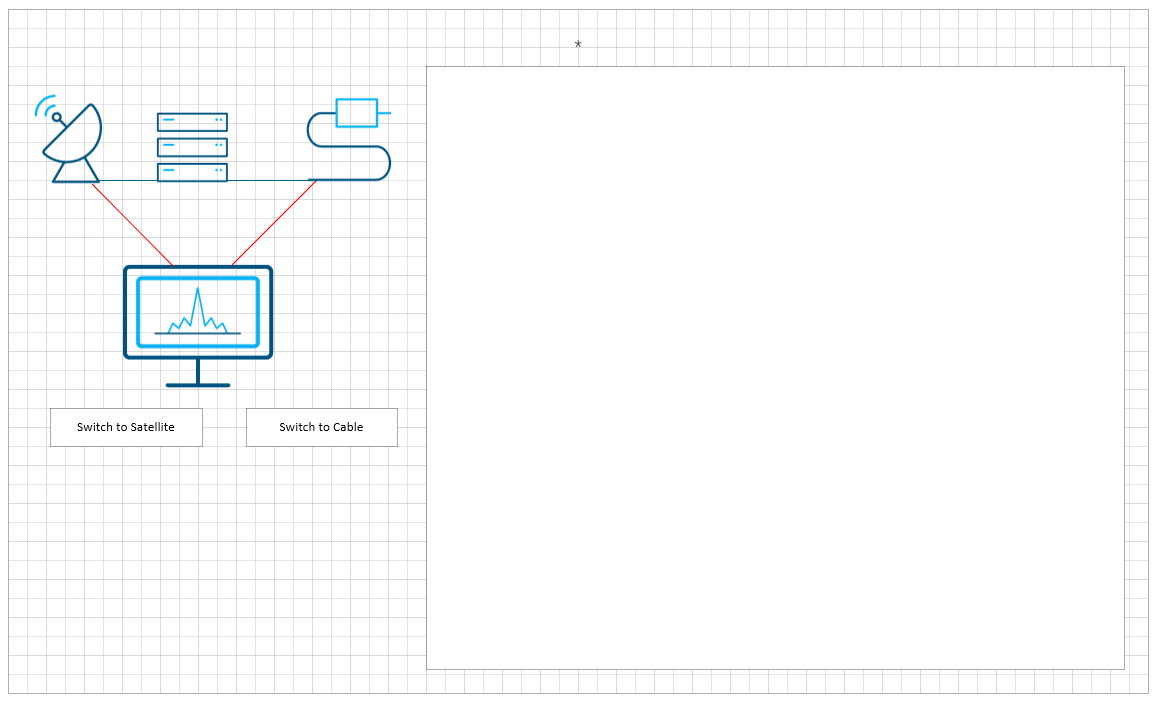
Add a number of images in the Visio file that represent the setup in your system.
Tip
To quickly get suitable images, you can use the Skylicons. In the example below, the dual-color versions of the cable, dish, monitor, spectrum, and stacked devices skylicons were used.
To add images, you can drag them from a location on your computer where you stored the images and drop them onto the Visio drawing.
You can also add images by selecting the Insert tab in the Visio ribbon, and then selecting Pictures. You can then navigate to the images you want to add and select them.
Draw lines that represent the connections between the components:
In the Home tab of the ribbon, click the downward arrow next to the rectangle in the Tools section, and select Line instead.
Drag lines between the shapes to make it look as if they are connected.
To enhance the visualization, change the line color for the connections to the image that represents the spectrum analyzer:
In the Home tab of the ribbon, select the Pointer Tool in the Tools section.
Select the line for which you want to change the color or thickness.
In the Shape Styles section of the Home tab, click the Line dropdown, and select the color you want to use.
If you want to also change the thickness of the line, open the Line dropdown again, go to Weight, and select the thickness you want to apply.
Step 10: Show only the current selection
To indicate which point of the setup is currently measured, you will now configure one of the lines to be hidden depending on the button that was last clicked.
Select the line between the satellite dish image and the spectrum analyzer image and define a shape data field with label
Showand value<A>-A|Value|[var:varPreset]|=Satellite (public).Tip
For more information on the Show condition format, see Extended conditional shape manipulation actions.
Add a shape data field with label
Showand value<A>-A|Value|[var:varPreset]|=Cable (public)for the connection line between the spectrum analyzer and the cable image.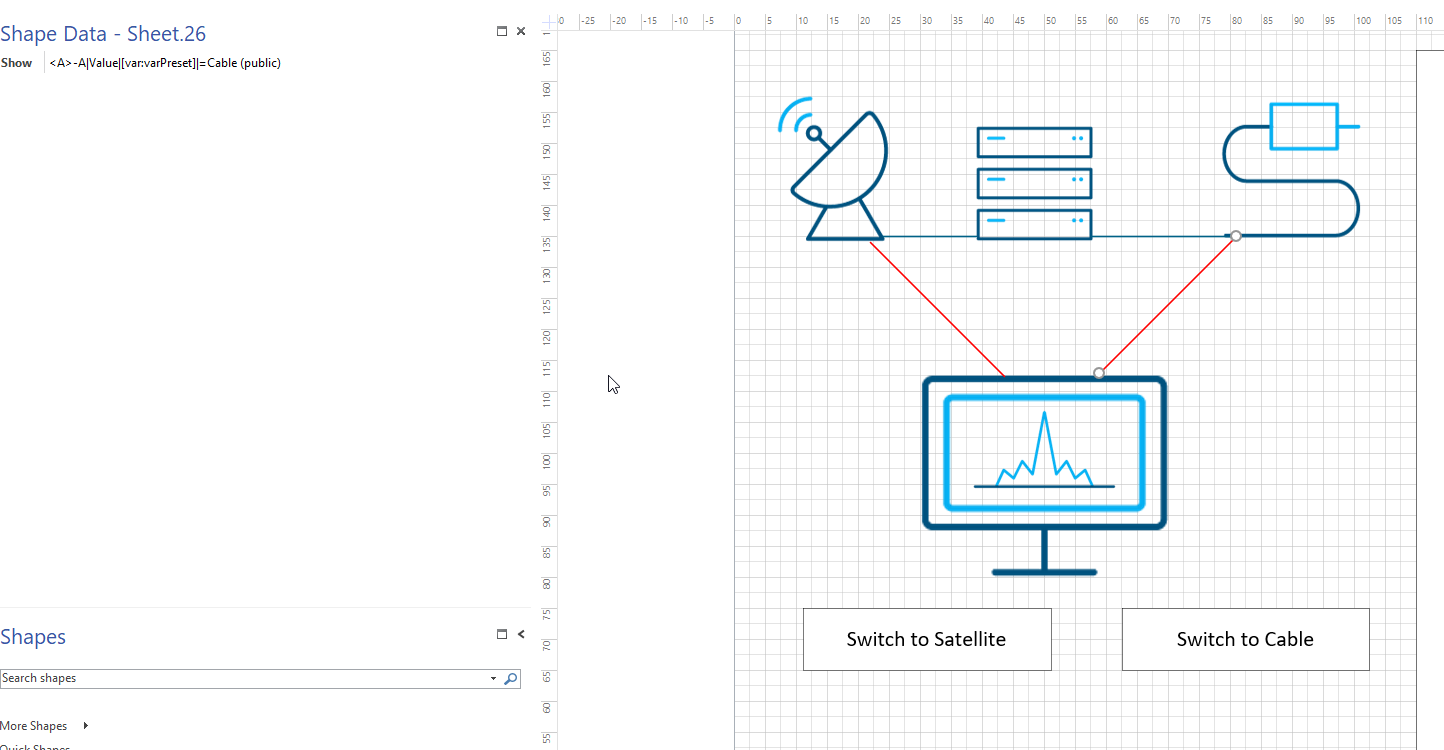
Make sure no more shapes are selected.
Save the Visio file.
On the Visual page in DataMiner Cube, click the buttons and verify whether the lines are correctly shown or hidden when the presets are switched.