Investigating OutOfMemoryException occurrences
Important
This section might include some information that is only applicable to Skyline employees and/or links that are only accessible to Skyline employees.
In case you encounter an SLScripting crash because the process ran out of memory, or you notice a memory leak in the SLScripting process, analyzing a memory dump of the SLScripting process can provide more info on what is causing the leak.
By default, a single instance of the SLScripting process is spun up by DataMiner. This process is responsible for executing the QActions of protocols. QActions execute C# code, which is executed by the CLR of the .NET Framework. Therefore, if you observe a memory leak in SLScripting, a good starting point is to analyze the managed memory of the SLScripting process.
Tip
For investigation purposes, you can also consider configuring DataMiner so that it creates a separate SLScripting process for each SLProtocol process. Refer to Configuring a separate SLScripting process for every protocol used and Element in Protocol logging for more information.
In case a crash occurs because the SLScripting process has run out of memory, the log files in the generated log collector package, e.g. the element log files and the SLErrorsInProtocol log file, should mention the occurrence of an OutOfMemoryException.
For example:
System.AggregateException: One or more errors occurred. ---> System.OutOfMemoryException: Exception of type 'System.OutOfMemoryException' was thrown.
   at ...
You can take a dump of the SLScripting process at any time via the SLNetClientTest tool (make sure to select the WithFullMemory checkbox) or by using tools such as ProcDump: procdump -ma "SLScripting.exe".
Tip
For more examples of how to use ProcDump, see Collecting DataMiner Cube memory dumps. Even though those examples are related to DataMiner Cube, ProcDump can be used to collect a dump of any process.
Investigating the crash dump in Visual Studio
Once you have a .dmp file (either extracted from the Log Collector package or created by another tool), you can investigate it using Visual Studio:
In Visual Studio, go to File > Open > File (or press
Ctrl + O).Select the .dmp file and click Open.
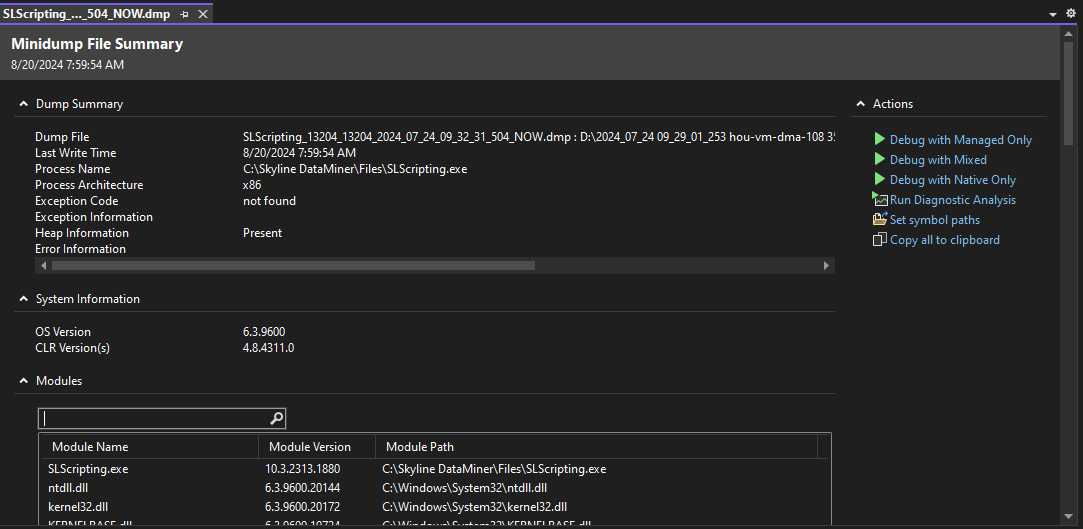
An overview of the Minidump File Summary will be shown:

In the Actions overview, click Run Diagnostic Analysis.
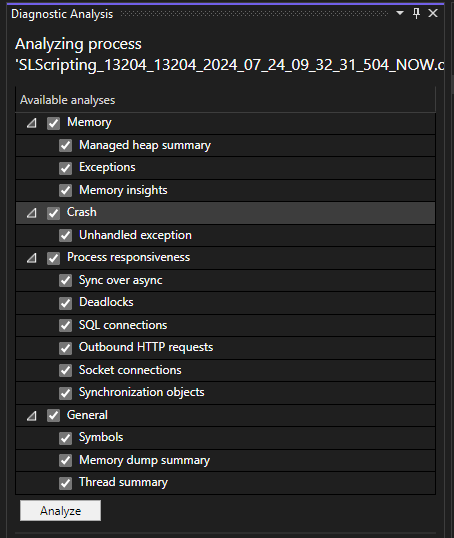
This will open the Diagnostic Analysis window.
Make sure all memory-related checkboxes are selected and click the Analyze button.

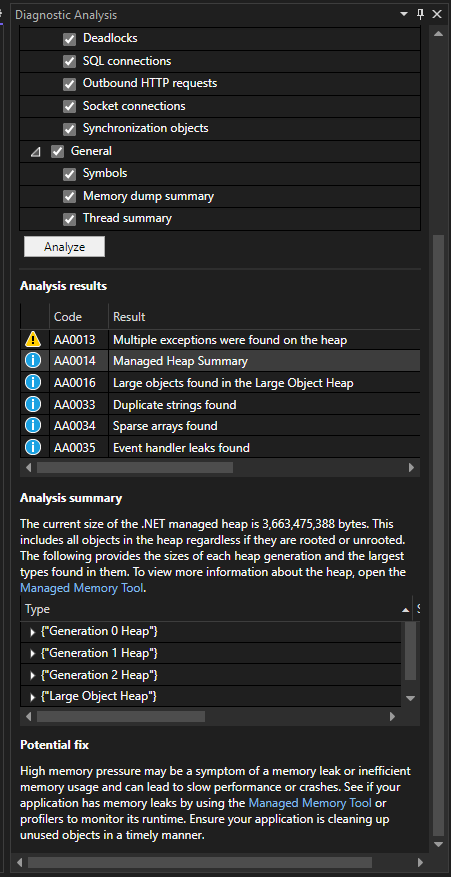
Once the analysis is complete, the analysis result will be shown in the window:

In case the analysis result contains an entry Managed Heap Summary, click the entry to see more information.
If the summary mentions the following potential fix, click the Managed Memory Tool link:
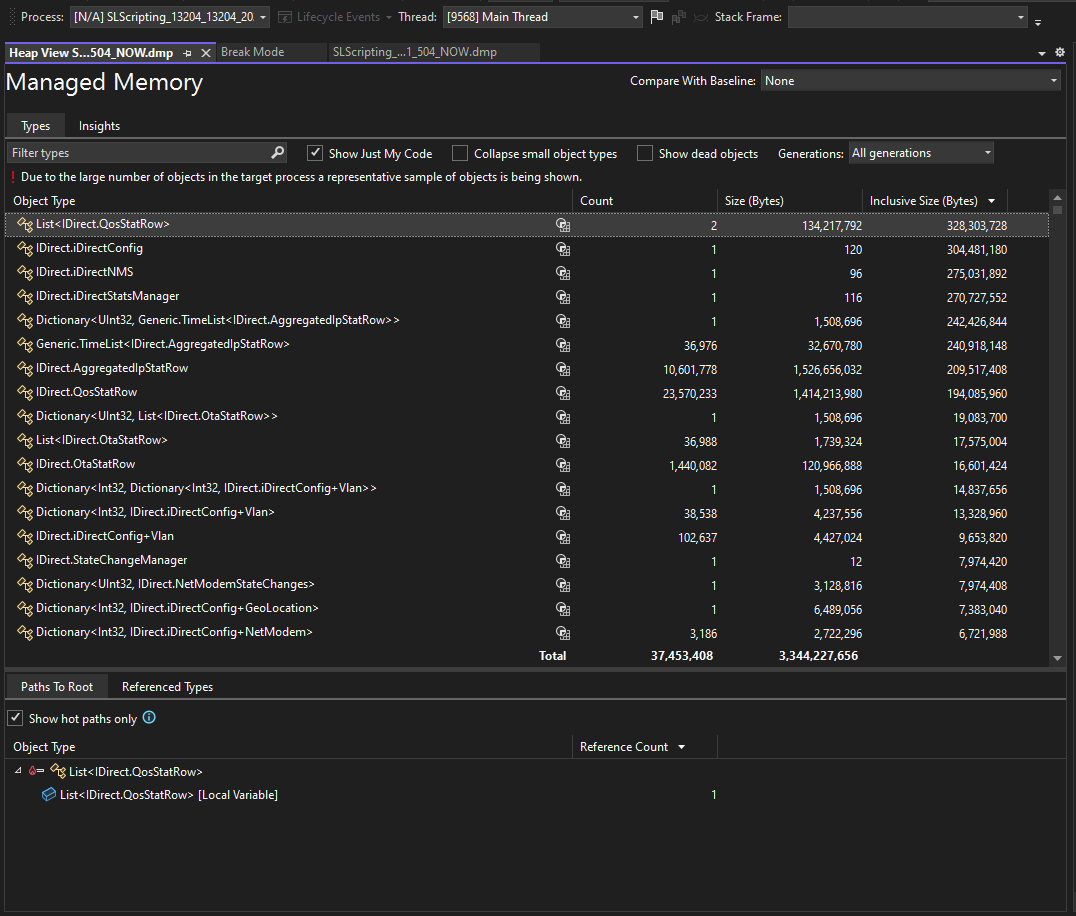
High memory pressure may be a symptom of a memory leak or inefficient memory usage and can lead to slow performance or crashes. See if your application has memory leaks by using the *Managed Memory Tool* or profilers to monitor its runtime. Ensure your application is cleaning up unused objects in a timely manner.Clicking the link will process the managed memory and give you an overview of the types of objects present in managed memory together with their size:

Based on this overview, you can investigate the objects consuming the most memory to get a better understanding of what is consuming the memory.
Note
In some cases, it could be that the analysis result does not show this potential fix and therefore does not provide a link to open the Managed Memory Tool. In that case, use another tool to inspect the managed memory, such as the Dump Analyzer Server (link for Skyline employees only), Memory Dump Analyzer SLScripting (link for Skyline employees only), or WinDbg.
Important
If you cannot identify any objects that are responsible for consuming the memory in managed memory, keep in mind that it is also possible that the leak is present in unmanaged memory. In this case, review whether objects are used that implement IDisposable and that were not properly disposed of, and verify whether you use code or class libraries that allocate unmanaged memory that was not properly released.