Data Visualization
Convert bits and bytes into uncluttered dashboards and easy control panels
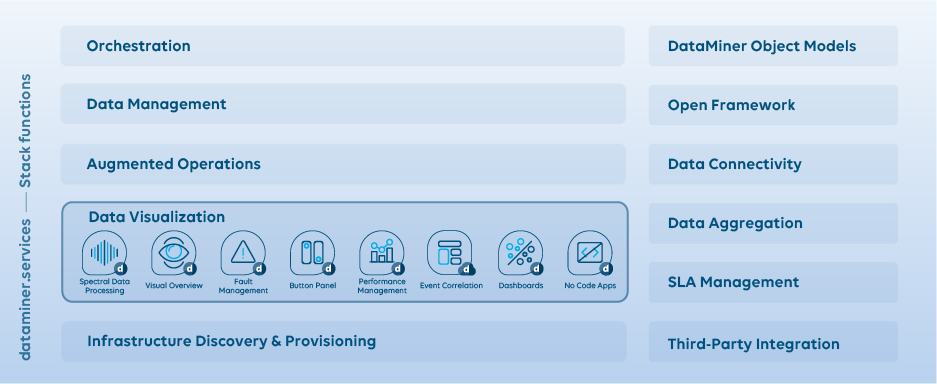
Spectral Data Processing
Processing remote sensing data from operational and historic missions in an online platform.
DataMiner Spectrum Analysis provides operators with the unique opportunity to benefit from real-time remote, multi-user RF measurements, as well as continuous 24/7 RF fault and performance management, by integrating with and processing RF data from:
any spectrum analyzer:
- high-end analyzers at strategic points in your operation
- mainstream commodity analyzers in high volume
- any product with spectrum monitoring measurement (e.g. cable modem, CMTS, remote PHY, etc.)
but also:
- legacy products
- packaged carrier management systems
and
- RF routing/switching solutions (L-band router, return path switch, etc.)
DataMiner brings it all together in one standard UI, with a rich set of features and capabilities that runs completely transparently across any analyzer you have today or will have at any time in the future.
Tip
For more information:
- Solution Overview: Spectrum analysis, monitoring and management
- Discover all the capabilities of DataMiner Spectrum Management in this 60-min. Experts & Insights webinar

- Example use case: Spectrum Assurance and Teleport Interference
- Example use case: L-Band Spectrum Monitoring
- Different spectrum-related videos in our video collection
- Different videos related to Visual Overview in our video collection
- DataMiner Spectrum Analysis
Performance Management
Ensuring that a set of activities and outputs meets an organization's goals in an effective and efficient manner.
This particular stack function keeps track of detailed historical key performance readings up to more than one year. Any parameter made available by the API of any data source (e.g. interface bandwidth, utilization (Mbps, %), rate errors, collisions, CPU usage, etc.) can be trended for later evaluation of its performance, for example for debugging or forecasting of future behavior.
DataMiner allows the user to define exactly for which parameters trending information has to be logged in the trending database and which kind of trending information has to be included. In a trend template, you can define both the scope (which parameters) and the type (real-time data, average trending, or a combination of both) of the trend information to be stored in the trending database.
Visual Overview
Clear visualization of data and insights.
DataMiner provides one of the most comprehensive and powerful UIs with extensive user-definable capabilities, allowing the display of mimic diagrams that are compatible with Microsoft Visio. By leveraging existing Visio drawings and harnessing the power of Microsoft Visio, operators can create visually appealing and fully customized graphical presentations of their DataMiner-managed operational ecosystem. Any part of the user's network can be graphically represented, tailored to their specific needs, at any level of the network and completed by any requested real-time data.
DataMiner further enriches these Visio drawings, using special shape data fields to provide highly customized graphical user interfaces.
In summary, Visual Overview offers a remarkably powerful and graphical way to navigate, monitor, and manage your entire infrastructure.
Tip
See also:
Event correlation
Detect identifiable patterns by relating various events.
The fully integrated Correlation Engine is a valuable asset for operators seeking to expedite the repair process through automated root cause analysis and move towards a proactive operation.
Correlation Engine provides the technology to further enhance alarm detection within the operational environment by processing the raw alarm information utilizing on a user-defined knowledge base, in real time as events occur.
The Correlation Engine is capable of:
Detecting single alarm events and patterns of alarm occurrences across the entire system.
Checking real-time parameter values, prior to making any decisions or taking actions.
Detecting single occurrences, persistent occurrences, or recurring occurrences of both single alarms events and alarm patterns across the entire operational environment.
Taking actions when certain conditions occur within the operational environment, including generating new alarm messages for the operator (e.g. the most probable cause), triggering Automation scripts (e.g. to take automatic corrective measures), notifying operators, and more.
DataMiner also includes root cause analysis (RCA) based on connectivity information. Connectivity information can be fed into the system via the integrated connectivity editor or by linking the DataMiner System to a third-party connectivity database. DataMiner's RCA functionality offers operators a highly intuitive method to determine the most probable cause and filter out sympathetic alarms. This is achieved by assigning an RCA level to each alarm, indicating how far they are removed from their probable root cause.
Fault management
Detect, isolate, and resolve problems.
Fault Management is one of the most fundamental and critical functionalities of a management platform.
It involves the ability to detect, isolate, and correct malfunctions in operational systems. However, achieving effective fault management remains a significant challenge for many operators.
With the current trends in the industry, this challenge is growing even more daunting by the day. The main cause of inadequate fault management is a loosely coupled architecture and the attempt to aggregate faults generated by disparate systems. By tapping into every piece of the actual installed base, DataMiner provides a real-time, end-to-end view of the complete ecosystem. As one of the most powerful fault management solutions in the industry, DataMiner offers a suite of fault management-related innovations that enable operators to pinpoint and resolve operational issues, faster than ever before by providing them with an intuitive multi-user management of active and historical alarms.
These innovations range from small gems such as highly user-definable device icons, which offer historical fault context information at a glance, to a notification banner with service impact analysis data, and revamped data tables with heatmap overlays and integrated histogram analysis. Furthermore, the core engine offers sophisticated off-the-shelf, self-learning algorithms to intelligently and effortlessly monitor and track the most challenging operational metrics, including traffic loads, slowly degrading quality metrics, and much more.
Today, raw data collection is the foundation of an efficient architecture. It maximizes the availability of information for the management platform to carry out its functions.
To address the challenges of fault detection, ensuring good data hygiene is key. DataMiner includes various ways to guarantee data hygiene, including:
- Fully user-definable and run-time-applied alarm thresholds defined in templates.
- Dynamic switching of alarm definitions based on time or events (e.g. upon service activation).
- Ability to stack alarm templates to easily and efficiently manage thresholds across vast deployments.
- Support for relative and absolute thresholds, including a variety of baseline methods.
- Hysteresis on trigger and/or clear, applicable to all individual thresholds.
- Conditional alarming to prevent unnecessary alarm clutter.
Unified fault detection is one of the most fundamental and critical functionalities of a management platform. DataMiner offers a unified approach with significant advantages:
- Gaining massive amounts of time to define and apply thresholds across your entire operation.
- Customizing alarm definitions exactly the way your operation requires, eliminating noisy alarms.
- Triggering alarms in a far more intelligent way and reducing the alarm count to what is truly necessary.
- Conserving valuable resources and time by reducing the need to resolve shortcomings with complex and cumbersome event correlation.
- Significantly reducing Mean Time to Repair (MTTR), increasing operational efficiency, lowering operational costs, and increasing Quality of Service (QoS).
The unified platform provides highly enriched fault messages, out of the box requiring zero effort.
Tip
For more information:
- New to DataMiner (DataMiner Operator): a collection of bite-sized videos on element states, Alarm Console features, etc.
- Videos related to alarm and fault management in our video collection
- DataMiner Alarm Console training video
- Experts & Insights – End-to-end fault management
- Alarms
Dashboards
Visual representation of any data.
DataMiner Dashboards enable operators to efficiently leverage the extensive, valuable real-time and historical operational information available in the DataMiner platform.
With the Dashboards app, you can create, manage, and view dashboards that display a wealth of information about the managed system.
Moreover, dashboards adhere to DevOps principles and can easily evolve over time at runtime. They can even be shared with just about anybody outside of the company through dataminer.services. Our built-in security functionality allows you control over the data you share, enabling you to determine which data is shared, with whom, and for how long.
Tip
See Dashboard Share for more information.
The DataMiner Dashboards app offers a wide range of visualizations that can make use of various data, including GQI-based queries. This "Queries" data item allows you to construct queries to access the wealth of data available in your DataMiner System. See also: Your next step towards a data-driven operation: the brand-new DataMiner Generic Query Interface (GQI)
Tip
For more information:
- Example use case: Dashboard Components Showcase
- Example use case: Monitor a Group of Servers via GQI
- DataMiner Dashboards
- DataMiner Dashboards training course
- Videos related to the Dashboards app in our video collection
- Videos related to GQI in our video collection
- Analyzing a network of switches with the DataMiner Dashboards module
- Analyzing performance of a Kubernetes Cluster with the DataMiner Dashboard module
A nice example of a dashboard component that covers many use cases is the node edge component, which can visualize any types of "nodes" (objects) and their "edges" (connections between them). This component is an addition to the catalog of out-of-the box data visualizations included in the DataMiner Dashboards app. It can be used in all sorts of applications that visualize objects and the relationships between them.
In many applications, there is a need to visualize certain objects and their interconnections. Think for example of network devices and their physical connectivity, a Kubernetes cluster showing the logical connections between its nodes, pods, and containers, or even video flows between media nodes in an IP network. This is all possible with the node edge dashboard component, as this a generic HTML dashboard component can visualize any types of nodes and edges. The component is designed in such a way that all types of DataMiner objects can be visualized as either nodes or edges, be it elements, rows in a table parameter, services, views, etc.
However, the node edge component is much more than just a visualization in a dashboard. It actually serves as a true analytics tool. To enable all kinds of analytical use cases, the component allows you to attach parameters and properties of DataMiner elements as KPIs to nodes and edges, which can for example be shown in a tooltip on a node or edge. On top of that, you can dynamically filter out, highlight, or color nodes and connections based on their KPIs. This can be used to quickly identify problems among a large set of nodes and see how these problems might affect other nodes. A visualization like this allows an operator to quickly visually correlate a lot of data, which can help to faster analyze incidents.
The data input for the node edge component can be configured via our Generic Query Language, an SQL-like language that can be used to query DataMiner objects, like elements, parameters, services, DCF connections etc.
Tip
For more information:
Button Panel (i.e. Control Panel)
Software button panels.
As media operations grow more complex and demanding so too does the need to have a control panel that is tailored to any specific situation or need. And on top of that, operators need to be able to execute complex actions with the push of a button.
With the DataMiner Button Panels, you can easily create different panels for different situations and securely share them with your stakeholders.
First of all, DataMiner Control Panels allow versatile control actions with the simple press of a button! You can trigger a wide range of actions, ranging from simple actions like an XY-style crosspoint, to complex workflows such as launching Automation scripts, controlling multiple bookings, or orchestrating both virtual and physical matrixes and endpoints.
Moreover, you have the freedom to customize the appearance and design of each DataMiner Control Panel. This includes not only buttons but also trend charts, thumbnails, real-time metrics and KPIs, spectrum analyzers, or any other elements that align with your specific needs.
And finally, the control panels enable true multi-tenant operations. You can create tailor-made control panels for any customer, partner, or supplier, and share them via the dataminer.services.
Tip
For more information:
- Example use case: DataMiner Button Panels
- Example use case:Sony LEO - router Panels
- Integration use case: Sony LEO – Riedel Smart Panel Integration
- Tailor-made control panels in a jiffy
- Webinar: DataMiner Routing Control Panel
- Real-time Software Router Control Panel Sharing
No-Code Apps
Create application software through graphical user interfaces.
The No-Code/Low-Code Apps toolset enables you to compose tailor-made apps for specific audiences, from the ground up with little to no coding experience.
Leverage your data! Thanks to DataMiner's support for every possible category of integration, no-code apps can leverage your data lake, providing deeper insights and value. You can monitor metrics from any data source in real time, aggregate and manipulate data abstracted from hardware products, and create views tailored to the needs of each of your teams. Perform real-time analytics using the *Generic Query Interface (GQI), also supporting external data sources.
Tip
Empower your teams to design, deploy, and operate their own customized applications with complete freedom in terms of both content and layout. Tailored applications increase efficiency and quality of your operations by letting teams focus on what truly matters to them.
No-code apps include graphical editors allowing you to define on-event behavior, enabling control and automation over your operations.
These apps run on HTML5, making them accessible from anywhere, including mobile devices, which is particularly beneficial for those working in the field.
Tip
For more information:
- Create your own powerful apps regardless of your coding abilities
- DataMiner Low-Code Apps: 5 things you need to know
- Using Button Components and Header Bars in Low-Code Apps
- Version Control for Low-Code Apps
- Example use case : Switch configuration with DataMiner Low-Code Apps
- Workflow use case : DataMiner Low-Code Apps & Telestream Vantage – Media Asset Workflow Automation
- Kata #3: Build your first low-code app
- Kata #7: Pages, panels and headers in a low-code app
- Kata #8: Actions and events in a low-code app
- Kata #13: Control and feeds in a Low-Code App
- DataMiner Low-Code Apps