Automatic alarm grouping
This DataMiner Analytics feature groups active alarms that are related, so that the Alarm Console provides a better overview of the current issues in the system. Unlike Correlation tracking, this can happen completely automatically, without any configuration by the user. DataMiner Analytics automatically detects which alarms share a common trait and groups them together.
Prior to DataMiner 10.4.0 [CU21]/10.5.0 [CU9]/10.5.12, this feature is called "automatic incident tracking".
Alarm groups in the Alarm Console
When this feature has been enabled in System Center, in the Alarm Console hamburger menu, you can activate it with the Automatic alarm grouping option (or prior to DataMiner 10.4.0 [CU21]/10.5.0 [CU9]/10.5.12: Automatic incident tracking).
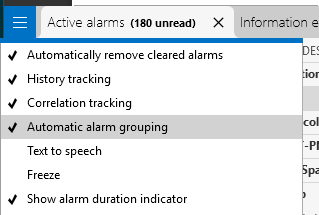
Alarm Console hamburger menu in DataMiner 10.6.1
In active alarms tabs, alarm groups will then be displayed as a special kind of alarm entries, with an icon similar to that of a correlated alarm. Like a correlated alarm, you can expand the entry to view all alarms within the group.
For example, here you can see an Active alarms tab with several alarm groups:
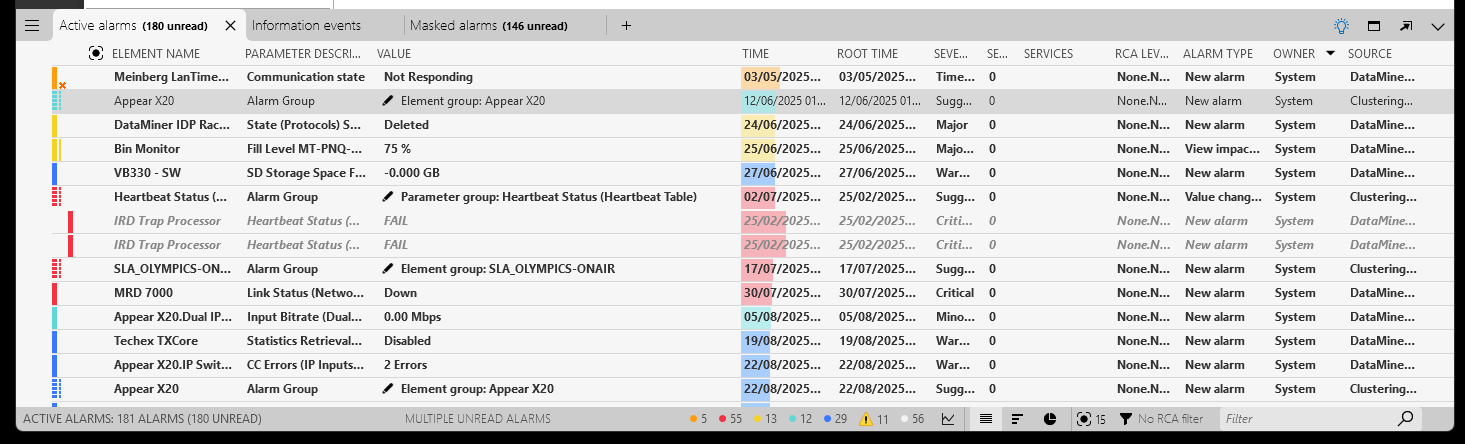
Alarm groups in the Alarm Console in DataMiner 10.6.1
Aside from the special icon, this is what an alarm group will look like:
- The alarm color of an alarm group entry reflects the highest severity among the alarms in the group.
- The Severity column shows the severity of the base alarm with the highest severity. Prior to DataMiner 10.5.0 [CU16]/10.6.0 [CU4]/10.6.7, the Severity column always shows Suggestion.
- The parameter description of the entry is Alarm Group.
- The value of the alarm group reflects the reason why the alarms are grouped. If there is no single obvious reason, the value will be Group with multiple reasons.
- The root time of the group is the time when the most recent alarm in the group occurred, at the moment when the group was created.
- If alarms are added to a group or removed from a group, the alarm type will be updated from New alarm to Base alarms changed.
Please note:
If all alarm entries within an alarm group are masked, the group is automatically masked as well. However, as soon as one of the entries is unmasked, the group is also unmasked.
Manually clearing automatically created alarm groups is supported from DataMiner 10.3.8/10.4.0 onwards. For manually created/updated alarm groups, this is supported from DataMiner 10.2.6/10.3.0 onwards.
When alarms are filtered, alarm groups are handled as follows:
If the alarm group matches the filter, the group and all its alarms are shown.
If the alarm group does not match the filter, but one or more alarms within the group match, the group and all its alarms are shown.
If neither the alarm group nor any of the alarms within the group match the filter, neither the group nor its alarms are shown.
Tip
It is possible to customize automatic alarm grouping. See Customizing alarm grouping rules.
Alarm grouping analysis
The following factors, in order, are taken into account for automatic alarm grouping:
Time
Alarm focus information
The polling IP (for timeout alarms only)
Service information
Relation learning: parameter relationship data (from DataMiner 10.3.1/10.4.0 onwards) and alarm relationship data (from DataMiner 10.3.7/10.4.0 onwards), on DataMiner Agents that are connected to dataminer.services, have the DataMiner Extension Module ModelHost installed, and have been configured to offload alarm and change point events to the cloud.
The IDP location
Note
The IDP location will only be taken into account if IDP is deployed and the option Update alarms on value changed is selected for the element properties 'Location Name', 'Location Building', 'Location Floor', 'Location Room', 'Location Aisle' and 'Location Rack'. See Adding a custom property to an item.
View information
Parameter information
Element information
Alarm, element, service or view properties, if these have been configured for alarm grouping (see Customizing alarm grouping rules).
If a single factor is used, it is mentioned in the value of the created alarm group.
The above-mentioned factors are applied in order, meaning that if multiple factors apply, the one listed first takes precedence. For example, if two alarms are from the same device (element factor) and also belong to the same service (service factor), the value of the alarm group will refer to the service, not the device, because the Service information factor is listed before the Element information factor.
Sometimes, multiple factors are combined to create an alarm group. For example, if you have a device with two alarms (Element information factor), and Relation Learning indicates one of these alarms is related to a different alarm on another element, a group of three alarms is created. In this case, the alarm group's value will indicate it is a "multiple reasons group".
If no suitable match is found, alarms will not be grouped. Also, since only alarms with an alarm focus score are taken into account, automatic alarm grouping does not apply to information events, suggestion events or notice messages.
The grouping of alarms into incidents is updated in real time whenever appropriate:
New alarms are added to existing groups if they match.
A group is cleared if its base alarms are cleared or if the reason for its original creation comes to an end.
If a group is cleared, any alarms in the group that are still active may be regrouped if other matching alarms exist, either in a new group or in an existing one.
Please note:
- Using automatic alarm grouping with history sets is supported; however, keep in mind that this may trigger the creation and immediate clearing of a large number of alarm groups.
- When an element is stopped or paused, the alarms associated with that element will not be taken into account when grouping alarms. Also, alarms associated with elements that are stopped or paused will be removed from any existing alarm group.
- When an element is swarmed to another Agent, any active anomalies (including alarm groups) that include that element will be cleared. This does not apply for manually created alarm groups, but note that prior to DataMiner 10.5.0 [CU8]/10.5.11, alarms from swarmed elements do get removed from manually created alarm groups.
- After a node is added to a DataMiner cluster, automatically generated alarm groups will temporarily be shown incorrectly. This issue will resolve itself within 30 minutes, but you can also manually fix this sooner by changing the Leader DataMiner ID in the automatic alarm grouping configuration in System Center.
Automatic alarm grouping configuration in System Center
In DataMiner Cube, you can enable this feature in System Center, via System settings > analytics config > automatic alarm grouping (or prior to DataMiner 10.4.0 [CU21]/10.5.0 [CU9]/10.5.12: automatic incident tracking). From DataMiner 10.2.0/10.2.1 onwards, in new installations and in systems upgrading from DataMiner versions that do not support automatic alarm grouping yet, it is enabled by default.
Note
Automatic alarm grouping relies on the alarm focus functionality. Ensure this feature is enabled in System Center, via System Center > System settings > analytics config, to guarantee the creation of alarm groups.
The following settings are available in System Center:
Enabled: Allows you to activate or deactivate this feature.
Leader DataMiner ID: The DMA performing all alarm grouping calculations. By default, this is the DMA with the lowest DataMiner ID at the time when alarm grouping is enabled.
Maximum group size: Available from DataMiner 10.1.11/10.2.0 onwards. When an alarm group reaches the maximum size specified in this setting, a new group will be created with all remaining alarms that belong to the same incident. Default value: 1000.
Maximum time interval: The maximum time interval between alarms that can be grouped as one incident. If the root times of alarms are further apart than the configured interval, the alarms will not be grouped. Default value: 10 minutes.
Maximum group events rate: Available from DataMiner 10.2.1/10.2.0 onwards. The maximum number of alarm group events that can be generated per second. This setting is used to avoid possible performance issues during alarm floods. If more events are generated per second than the specified number, the generation of events is slowed down, and a notice alarm is generated. As soon as the number of generated events drops below the threshold again, the notice alarm is cleared and events are again generated as quickly as possible. Default value: 100.