Dashboard
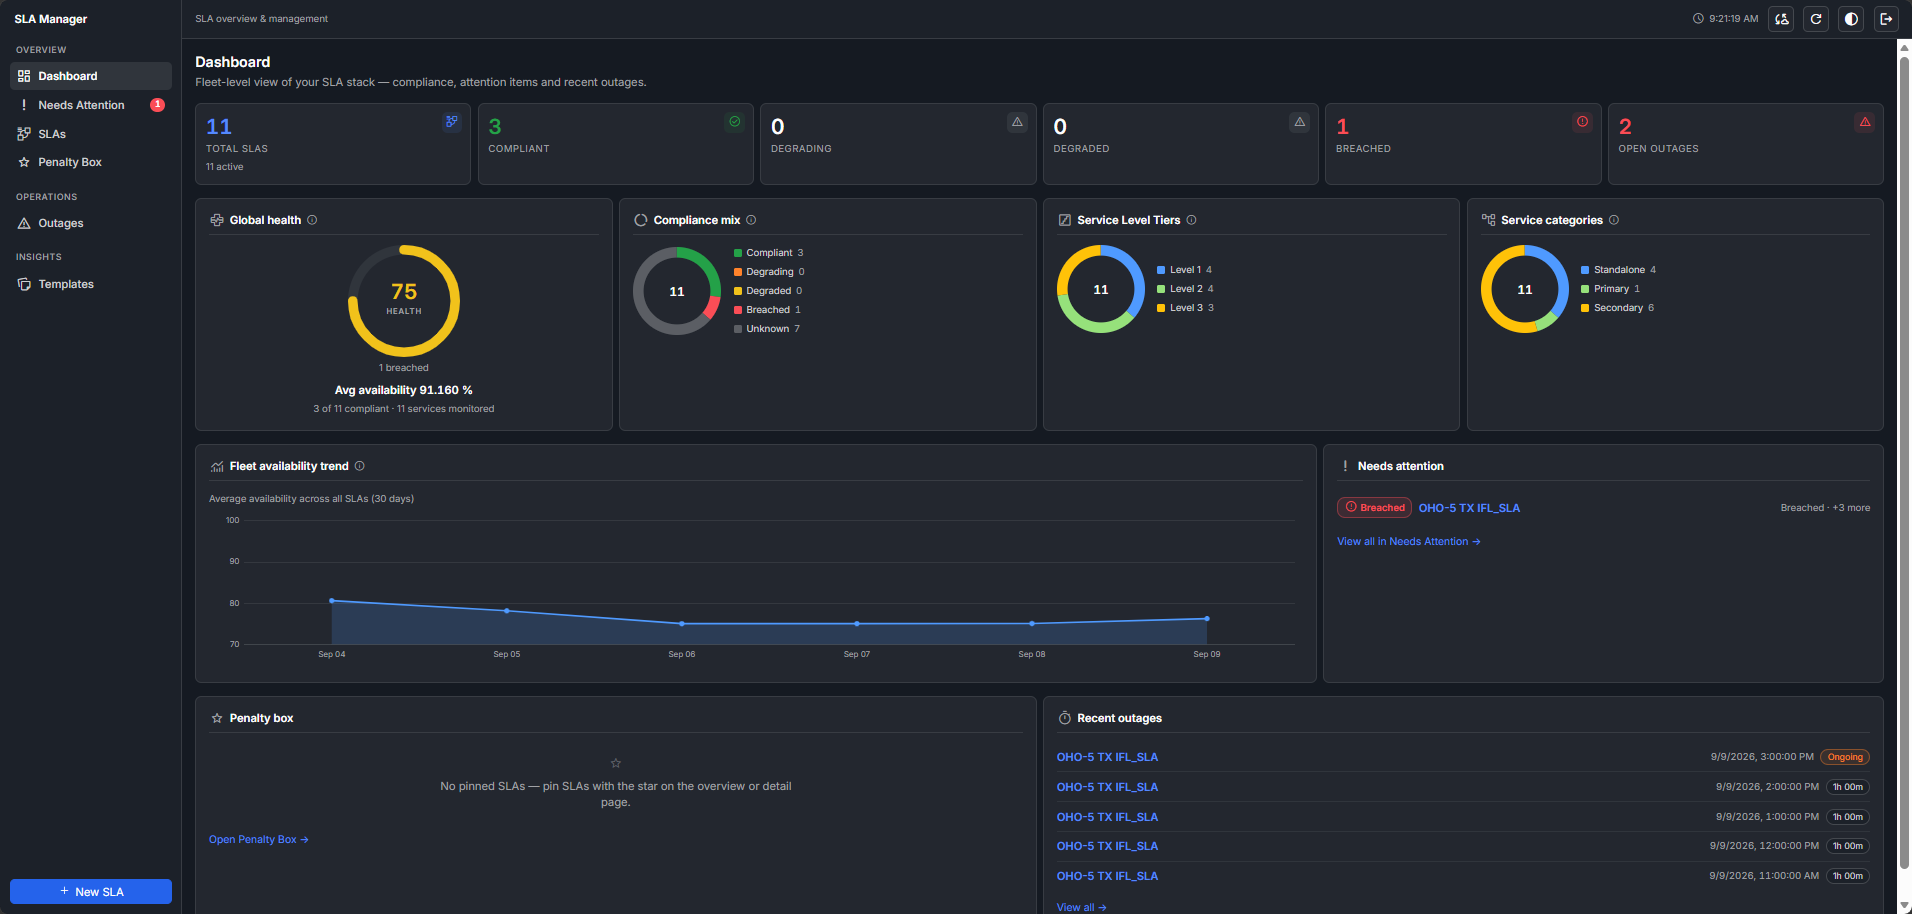
The Dashboard gives you a fleet-level view of your SLA stack, including compliance, health, and recent outages.
KPI cards
At the top of the page, KPI cards summarize the total number of SLAs and how many are Compliant, Degrading, Degraded, or Breached, as well as the number of open outages.
Health and compliance charts
- Global health: An overall health score, together with the average availability across all SLAs.
- Compliance mix: The number of SLAs in each compliance state.
- Service Level Tiers: The number of SLAs per service level tier.
- Service categories: The number of Standalone, Primary, and Secondary SLAs.
Fleet availability trend
A chart shows the average availability across all SLAs over a configurable period (30 days by default).
Needs attention
A panel lists the SLAs that currently need attention, for example because they are breached.
For more information, see Needs attention.
Penalty box
A panel shows the SLAs you have pinned.
For more information, see Penalty box.
Recent outages
A list shows the most recent outages across all SLAs.
For more information, see Outages.