Working with DCF interface properties in GQI queries
In this tutorial, you will learn how to work with GQI queries that contain DCF interface information. By way of example, the tutorial will show how you can display information about the DCF interface properties using a grid visualization. Using GQI query filter components, you will then be able to filter the displayed interfaces.
Estimated duration: 20 minutes.
Tip
See also: Kata #45: DataMiner Connectivity Framework and Kata #55: Advanced Features of the DataMiner Connectivity Framework, available on DataMiner Dojo.
Prerequisites
- A DataMiner System that is connected to dataminer.services.
- Make sure the GenericInterface soft-launch option is enabled. See Soft-launch options.
Tip
If you use a DaaS system, these prerequisites are automatically met.
Overview
- Step 1: Deploy the tutorial package from the Catalog
- Step 2: Provision DCF connections and properties
- Step 3: Configure the visualizations
Step 1: Deploy the tutorial package from the Catalog
To deploy the package:
Go to the Kata DCF package in the Catalog.
Deploy the latest version of the package on your DMA using the Deploy button.
The package will deploy the following components:
The Generic Data Simulator connector, which exposes DCF interfaces and will be used by the elements created for this tutorial.
The SLC-AS-Kata-DCF Automation script, which will be used to provision the view, elements, DCF interface properties, DCF connections, and properties required for this tutorial.
The kata_dcf_view.vsdx Visio file, which will be used to visualize DCF interfaces, connections, and related properties in Cube.
The KATA_DCF dashboard, located in the dashboard folder with the same name. This is the dashboard used in the previous tutorial Getting started with DCF and in Kata #45.
The KATA_DCF_ADVANCED dashboard, located in the same folder. This blank dashboard will be used for this tutorial and contains the following GQI queries:
- DCF_ELEMENTS: The nodes representing the routers, switches, and PCs available in the network diagram.
- DCF_ELEMENTS_POSITION: The positions for the nodes available in this tutorial.
- DCF_INTERFACES: The DCF interfaces exposed by the elements created for this tutorial.
- DCF_CONNECTIONS: The DCF connections created for this tutorial.
- DCF_CONNECTIONS_PROPERTIES: Properties related to the DCF connections available in this tutorial.
When the package has been fully deployed, in the Automation module in DataMiner Cube, go to the folder Kata DCF and execute the script SLC-AS-Kata-DCF to provision the components required for this tutorial.
Tip
See also: Manually executing a script
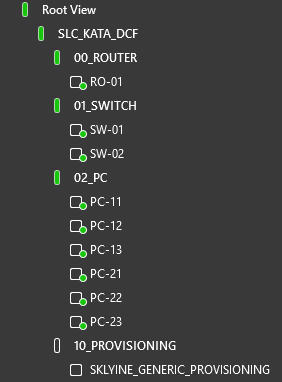
When the script is complete, the following items should become available in the Surveyor:
Views:
- SLC_KATA_DCF
- 00_ROUTER
- 01_SWITCH
- 02_PC
- 10_PROVISIONING
Elements:
- RO-01
- SW-01
- SW-02
- PC-11
- PC-12
- PC-13
- PC-21
- PC-22
- PC-23
- SKYLINE_GENERIC_PROVISIONING
If you have not yet done so in the previous tutorial, assign a Visio file to the DLC_KATA_DCF view:
In the Surveyor, select the view SLC_KATA_DCF.
Right-click the VISUAL page, select Set as active Visio file > Existing, and select the file kata_dcf_view.vsdx.
If you cannot see that Visio file listed in the window, click Other file and browse to the folder
C:\Skyline DataMiner\Views. You will be able to select the file there. If you do not have access to this folder, restarting the DMA will also make the Visio file become available in the window.Tip
See also: Editing a Visual Overview in DataMiner Cube.
Step 2: Provision DCF connections and properties
Note
If you are doing this tutorial on the same system where you have already done the previous tutorial Getting started with DCF, you can skip this step completely, because you have already taken care of the provisioning.
In the Automation module in DataMiner Cube, go the folder Kata DCF and execute the script SLC-AS-Kata-DCF-Advanced to provision the DCF interface properties.
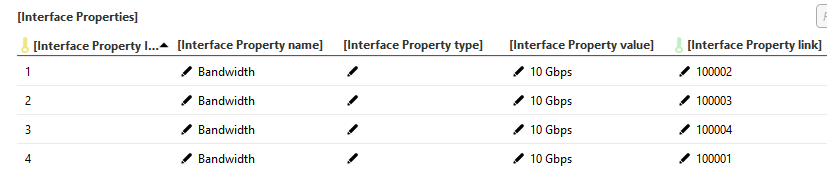
Confirm that these properties have been correctly provisioned:
Open a router, switch, or PC element that was added earlier in this tutorial, and go to the page General Parameters.
Next to DataMiner Connectivity Framework, click the Configure button.
Check if the [Interface Properties] table contains the DCF interface property Bandwidth for each port available in the Interfaces table (4 in total).
Tip
See also: General parameters
Open the element SKYLINE_GENERIC_PROVISIONING.
Go to the DCF Import page of the element and click the Import button.
When the Progress parameter indicates 100, the Status parameter should indicate that 8 connections were found and imported.
Open the overview available in the view SLC_KATA_DCF (tab dcf) and confirm that all the DCF connections were provisioned correctly.
The following connections should be displayed:
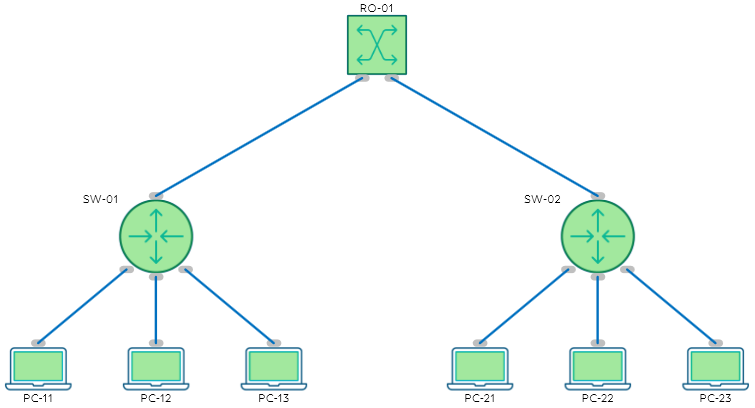
Step 3: Configure the visualizations
Go to the Dashboards app.
In the pane on the left, in the KATA_DCF folder, select the dashboard KATA_DCF_ADVANCED.
Click the pencil icon in the dashboard header bar to start editing the dashboard.
Drag a Grid visualization from the pane on the left onto the dashboard.
Drag a Query Filter visualization from the pane on the left onto the dashboard.
Drag the edges of both components to resize them so they will be large enough to display all the interfaces.
In the Data pane on the right, expand the Queries node, and drag the query DCF_INTERFACES to both components.
Tip
Take a look at the GQI query to further understand how the GQI query was built to retrieve the DCF interface property.
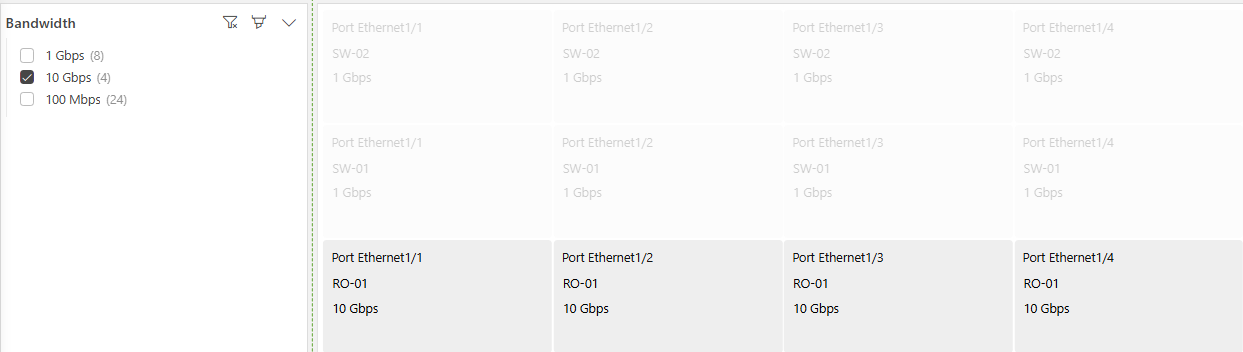
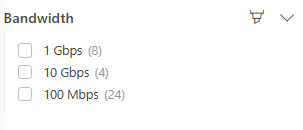
In the Data pane, expand the query DCF_INTERFACES and drag the Bandwidth column to the Query filter visualization.
Make sure the query filter component is selected, go to the Settings pane on the right, and enable the Filter assistance option.
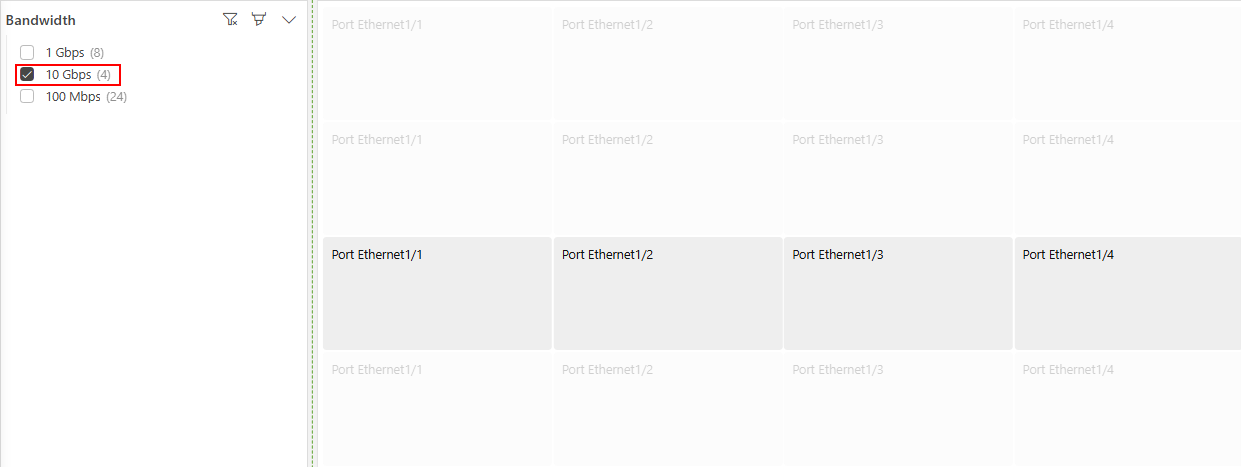
As a result, you should now see three possible suggestions for the Bandwidth column.
In the Data pane on the right, expand Components > Query Filter, and drag the Query columns item to the grid component as a filter.
Stop editing the dashboard so you can test the query filter.
When one of the values available for the Bandwidth is selected in the query filter, only the DCF interfaces that match the value of this property will be highlighted.
Edit the dashboard again, select the grid component, and in the Layout tab on the right, click Edit at the bottom to open the template editor.
Tip
See also Using the Template Editor
Add two text layers to display the element name of the DCF interface and the Bandwidth DCF interface property:
Go to the Tools pane on the left, select Text, and drag an area below the {Name} placeholder to add a text layer there.
In the pane on the right, change the value
Textto{Element Name}.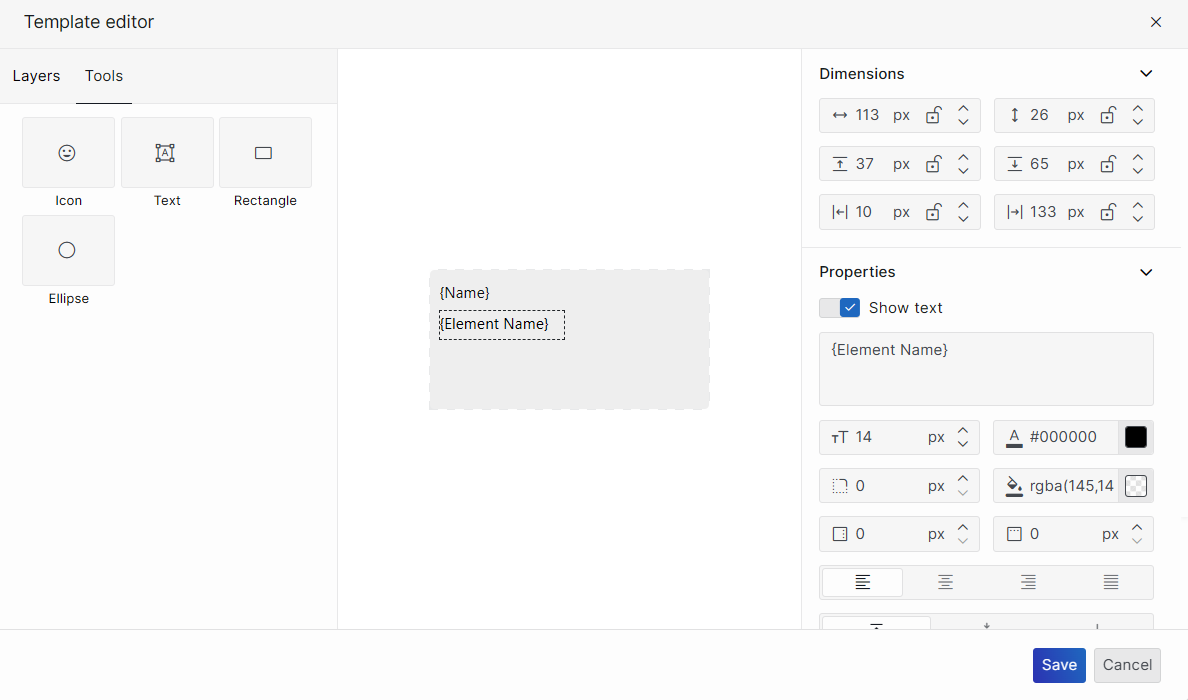
Repeat the steps above to add another text layer below that with the value
{Bandwidth}.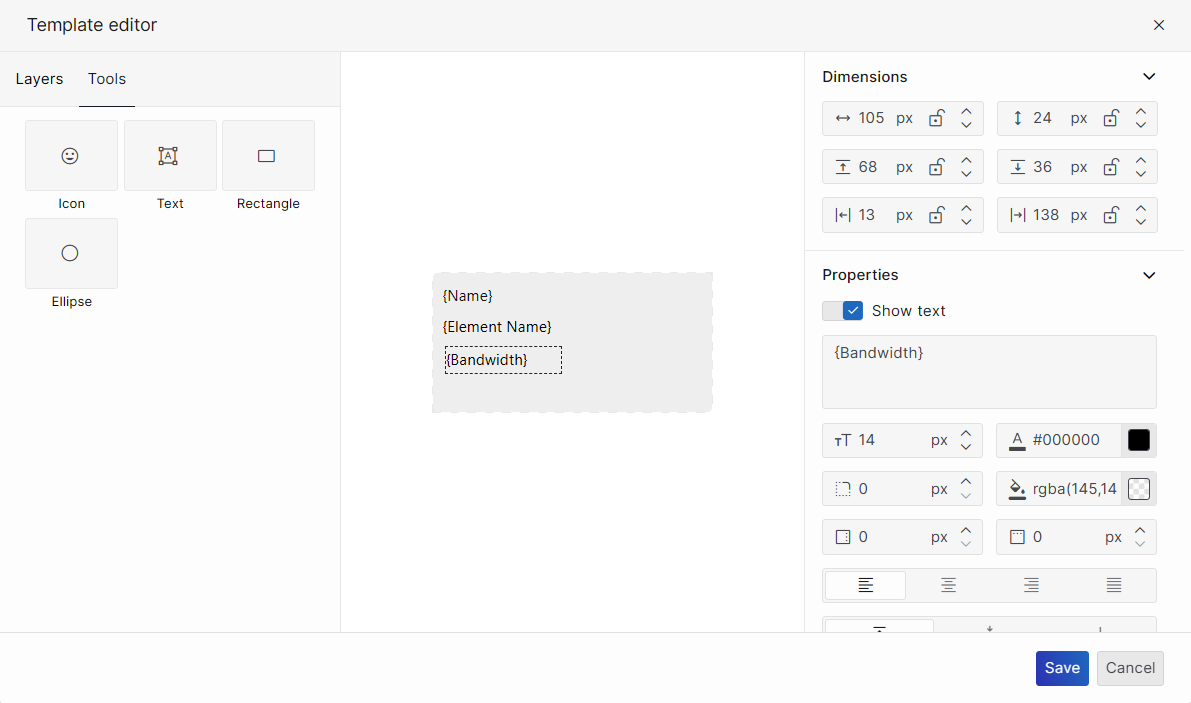
Click Save.
The grid should now display the element name and bandwidth for each interface.