Embedding a connector dashboard in Visual Overview
In this tutorial, you will learn how to embed a dashboard for a specific connector in Visual Overview. This way, users who typically use DataMiner Cube as their main user interface will have easy access to the dashboard. The tutorial includes the creation of a dashboard that relates to a single (configurable) element using a particular connector, so that it can automatically visualize the content related to that element. Note that you can also embed other types of dashboards in Visual Overview, but this tutorial will focus on the use of dynamic inputs to automatically view the related content of a dynamic dashboard.
Expected duration: 20 minutes
Tip
- An application package is available in the Catalog that demonstrates the outcome of this tutorial.
- When you design a dynamic dashboard (e.g. with a configurable element), you need to use a feed, which can be a Dropdown component, so that a value can be dynamically assigned when the dashboard is embedded.
- See also: Kata #20: Integrating dashboards in DataMiner Cube on DataMiner Dojo

Note
The content and screenshots for this tutorial have been created in DataMiner 10.3.7.
Prerequisites
Select a suitable element in your DataMiner System for which you will be able to embed a dashboard in Visual Overview as illustrated below. If no such element exists yet, create one.
DataMiner 10.2.0/10.2.2 or higher.
Microsoft Visio 2010 (with Visio 2010 SP2 or the Visio Compatibility Pack) or a more recent version of Microsoft Visio.
Overview
The tutorial consists of the following steps:
- Step 1: Create a dynamic dashboard
- Step 2: Prepare the URL for use in Visio
- Step 3: Create Visio and embed Dashboard
Step 1: Create a dynamic dashboard
Add a Dropdown component to show all the elements of a specific connector:
In edit mode, drag and drop the Dropdown visualization from the pane on the left on to the main dashboard area.
In the Data pane, select Elements under All available data, and drag this to the component.
The dropdown component is now configured to show all available elements.
Click the yellow filter icon under the component, select a protocol under All available data > Protocols, and drag it to the component.
The dropdown component will now only show elements using this specific protocol. Make sure this is the protocol of the element you have selected to use for this tutorial.
Add extra components to your dashboard:
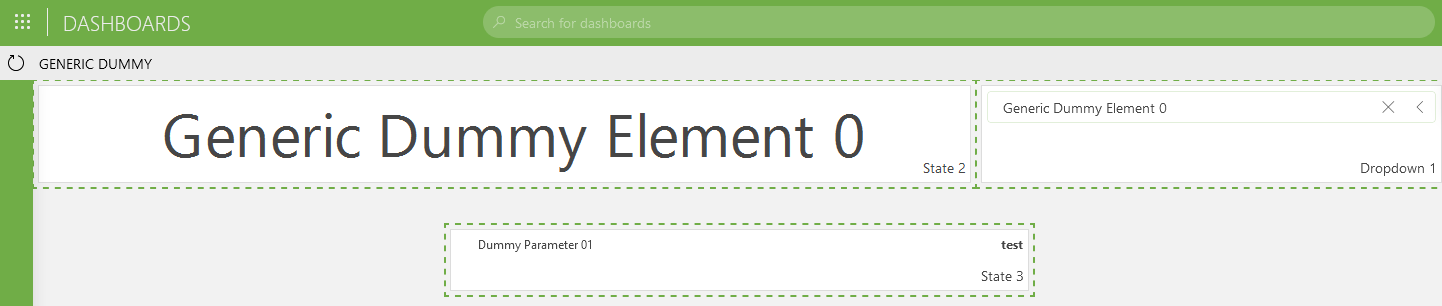
Add a State visualization from the pane on the left, and configure it to use the data Feeds > Dropdown > Elements.
This component will show the name of the selected element.
Add another State visualization, configure it to show one or more parameters of interest based on the Parameters > From: Protocol data section, and use the yellow filter icon to add Feeds > Dropdown > Elements as a filter.
This component will show the name and value of the parameters you have added for the element selected in the dropdown component.
Click the icon in the top-right corner to stop editing the dashboard.
Click the ... button in the top-right corner and select Share.
Select URL, select the Embed and Use uncompressed URL parameters check boxes, and click Copy.
You have now copied the basic embed URL of your new dashboard. This can for instance look like this:
https://localhost/dashboard/#/db/Generic%20Dummy.dmadb?data=%7B%22version%22:1,%22feed%22:null,%22components%22:%5B%7B%22cid%22:2,%22select%22:%7B%22elements%22:%5B%22172%2F82%22%5D%7D%7D,%7B%22cid%22:1,%22select%22:%7B%22elements%22:%5B%22172%2F82%22%5D%7D%7D%5D,%22feedAndSelect%22:%7B%7D%7D&embed=trueTip
See also: Sharing a dashboard
Step 2: Prepare the URL for use in Visio
Before you can actually use the URL you have copied, some manual adjustments are necessary. For this, you will have to decode the URL, add dynamic arguments to use in your Visio file, and then re-encode the URL:
Decode the URL using the tool of your choice.
You can for example do this with the MIME Tools plugin for Notepad++ (using the URL Decode command). The result should look similar to this example:
https://localhost/dashboard/#/db/Generic Dummy.dmadb?data={"version":1,"feed":null,"components":[{"cid":2,"select":{"elements":["172/82"]}},{"cid":1,"select":{"elements":["172/82"]}}],"feedAndSelect":{}}&embed=trueCheck which "cid" in the URL corresponds with which component ID in the dashboard.
To do so, check which ID is shown on the components when the dashboard is in edit mode.

Change the URL so that only the configuration related to your dynamic input component, in this case the dropdown component, is kept.
This means that only the section with the "cid" corresponding to the ID of that component should be kept.
For example:
https://localhost/dashboard/#/db/Generic Dummy.dmadb?data={"version":1,"feed":null,"components":[{"cid":1,"select":{"elements":["172/82"]}}],"feedAndSelect":{}}&embed=trueReplace the fixed element ID by a dynamic element ID.
In this example, this means replacing the element ID "172/82" with the Visio placeholder
[this elementID]. However, this placeholder has to be escaped in the URL so that it is correctly resolved. To do so, use the placeholder[EscapeDataString:[this elementID]].https://localhost/dashboard/#/db/Generic Dummy.dmadb?data={"version":1,"feed":null,"components":[{"cid":1,"select":{"elements":["[EscapeDataString:[this elementID]]"]}}],"feedAndSelect":{}}&embed=trueRe-encode the URL using the tool of your choice.
The value of the data query parameter is JSON and must be encoded. However, make sure you exclude
[EscapeDataString:[this elementID]].https://localhost/dashboard/#/db/Generic Dummy.dmadb?data=%7B%22version%22%3A1,%22feed%22%3Anull,%22components%22%3A%5B%7B%22cid%22%3A1,%22select%22%3A%7B%22elements%22%3A%5B%22[EscapeDataString:[this elementID]]%22%5D%7D%7D%5D,%22feedAndSelect%22%3A%7B%7D%7D&embed=trueAdd the dynamic placeholder
<DMAIP>, so that the URL can be used on any DataMiner Agent.https://<DMAIP>/dashboard/#/db/Generic Dummy.dmadb?data=%7B%22version%22%3A1,%22feed%22%3Anull,%22components%22%3A%5B%7B%22cid%22%3A1,%22select%22%3A%7B%22elements%22%3A%5B%22[EscapeDataString:[this elementID]]%22%5D%7D%7D%5D,%22feedAndSelect%22%3A%7B%7D%7D&embed=true
Tip
Step 3: Create a Visio file and embed the dashboard
In DataMiner Cube, go to the Visual page of the element you have selected.
Right-click the page and select Set as active [your element name] element Visio file > New blank.
This will open a new, blank drawing in Microsoft Visio, which will automatically be assigned to the current element.
Add a shape to the Visio page with the following shape data:
Link: #https://<DMAIP>/dashboard/#/db/Generic Dummy.dmadb?data=%7B%22version%22%3A1,%22feed%22%3Anull,%22components%22%3A%5B%7B%22cid%22%3A1,%22select%22%3A%7B%22elements%22%3A%5B%22[EscapeDataString:[this elementID]]%22%5D%7D%7D%5D,%22feedAndSelect%22%3A%7B%7D%7D&embed=true
Dock: Left|Right|Top|Bottom
Note
The '#' in the Link shape data will allow you to see the dashboard directly in Visual Overview.
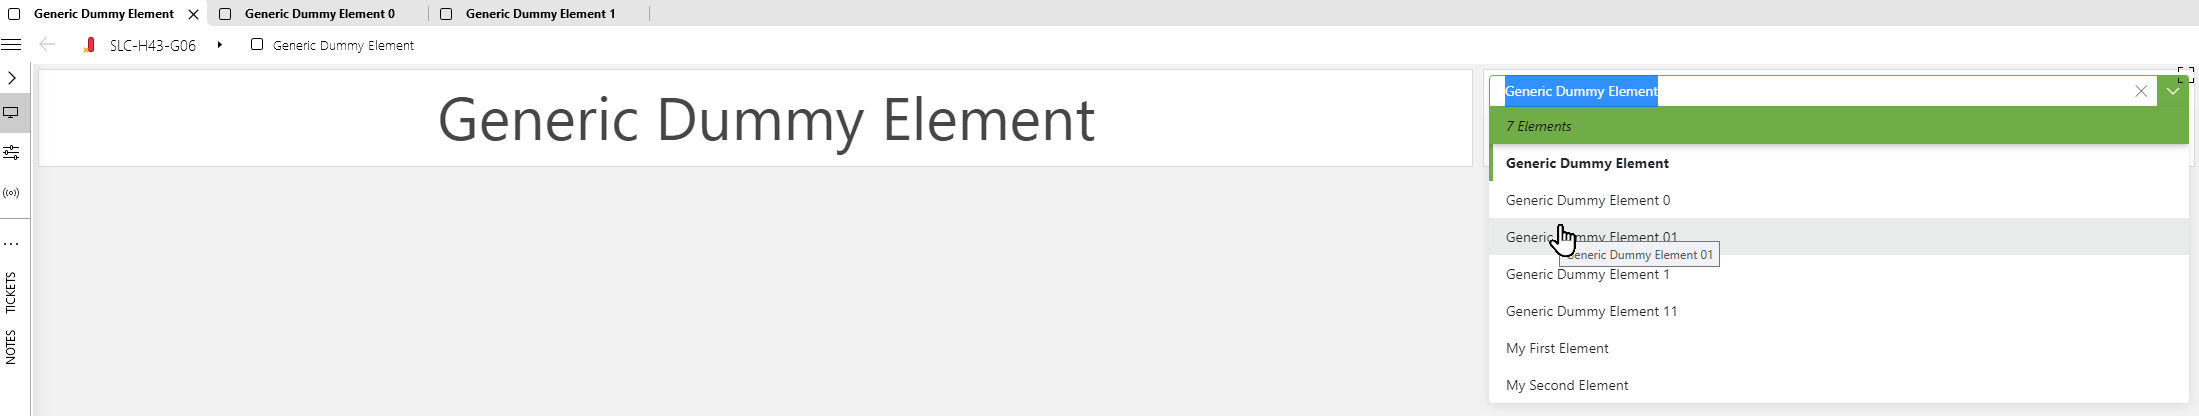
Save the file and check the result in DataMiner Cube.
You should now see the dashboard nicely embedded in Visual Overview.