Improving anomaly detection using feedback
DataMiner's behavioral anomaly detection automatically detects when a parameter in your system is behaving in an unexpected way. It does this by modeling the behavior of the parameter based on its recent history, and generating a suggestion event or alarm when that behavior deviates significantly from that model. However, in some cases, DataMiner may not work optimally out of the box and it may, for example, generate an anomaly too quickly.
In this tutorial, you will learn how to improve the detection of new anomalies by providing feedback on detected anomalies.
This tutorial does not require any prior knowledge of anomaly detection in DataMiner. However, if you want to learn more about its basic features and how to configure alarming based on anomalies, we recommend completing the Detecting anomalies with DataMiner tutorial.
By default, behavioral anomaly detection is enabled on trended parameters. Similar to the Detecting anomalies with DataMiner tutorial, history sets are used to simulate parameters with historical trend data. The parameters used in this tutorial have trending enabled by default.
Estimated duration: 25 minutes.
Note
The content and screenshots for this tutorial were created in DataMiner 10.4.11.
Tip
See also:
- Providing user feedback
- Kata #46: Improve anomaly detection with feedback on DataMiner Dojo

Prerequisites
DataMiner 10.4.11 or higher with Storage as a Service (STaaS) (recommended) or an indexing database.
A DataMiner System connected to dataminer.services.
Behavioral Anomaly Detection is enabled (in DataMiner Cube: System Center > System settings > analytics config).
The time to live for trending is at least 1 day for real-time trending and 1 month for minute records.
Overview
This tutorial consists of the following steps:
Step 1: Install the example package from the Catalog
Go to https://catalog.dataminer.services/details/4d0fa49c-6355-42d5-943d-e747b6c62906.
Deploy the Catalog item to your DataMiner Agent by clicking the Deploy button.
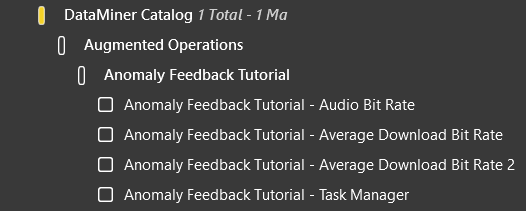
This will create several DataMiner elements in your system that will be used throughout the rest of this tutorial. The elements will be located in the view DataMiner Catalog > Augmented Operations > Anomaly Feedback Tutorial.
Step 2: Remove unwanted anomalies by giving negative feedback
In this step, you will give negative feedback to unwanted level shift anomalies on an audio bit rate parameter, and you will see that, over time, DataMiner learns from this feedback and stops marking similar level shifts as anomalies.
In DataMiner Cube, select the element Anomaly Feedback Tutorial - Audio Bit Rate in the Surveyor.
This element simulates an encoder with multiple audio channels, and is used to monitor the bit rate of these channels.
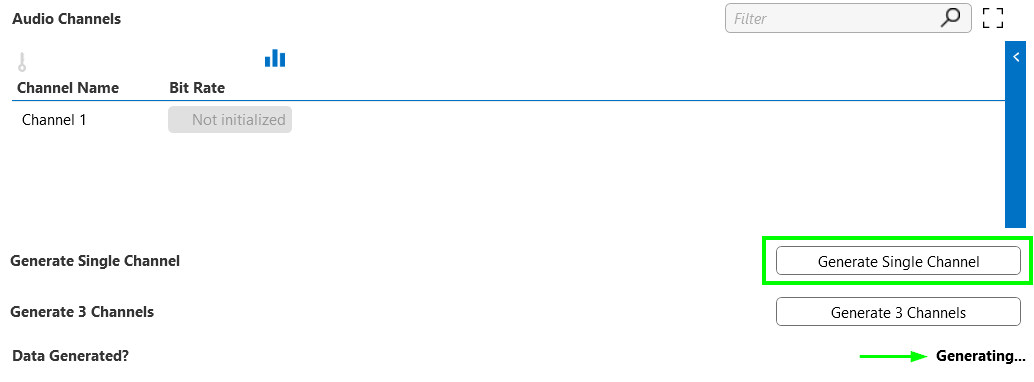
Click the Generate Single Channel button.
This will generate bit rate data for a single channel in the table Audio Channels above.
Important
Throughout this tutorial, when generating data, always wait until the Data Generated? parameter displays Yes before proceeding to the next step.
Open the trend graph for the bit rate of the newly generated audio channel by clicking
 next to the Channel 1 parameter in the Audio Channels table.
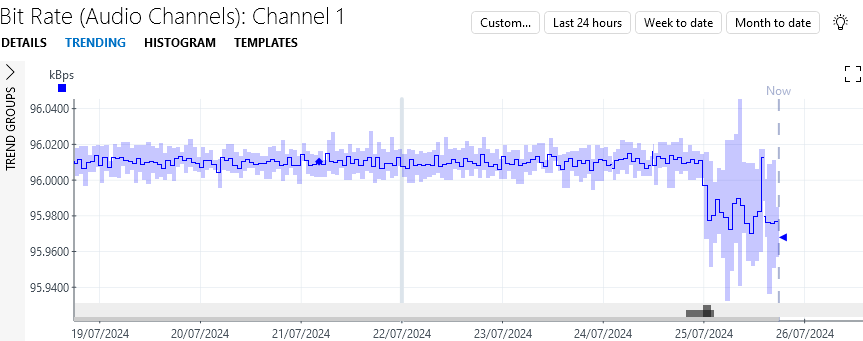
Click Week to date to see the data for the past week.
You will see that the bit rate remained very stable just above 96 kBps, then suddenly drops slightly and starts to fluctuate more. This behavior is typical when switching an audio bit rate parameter from Constant Bit Rate (CBR) encoding to either Average Bit Rate (ABR) or Variable Bit Rate (VBR) encoding. ABR and VBR allow greater, temporary deviations from the target bit rate. A drop or a jump at the moment of the switch, as you see here, is common but not guaranteed.
Just below the bit rate drop, two dark gray blocks are displayed, indicating two detected changes in behavior, or change points. This means two anomalies were detected at that moment. If you hover the mouse over them, you will see that one is a variance change, corresponding to the parameter becoming less stable, and the other is a level shift, corresponding to the drop.
Note
Since the two anomalies occur around the same time, the labels that appear when you hover over the change points might overlap, causing one label to be hidden. To view both labels clearly, zoom in by pressing Ctrl while scrolling up. After zooming in, you can revert back by clicking the Week to date button again.
Click the light bulb icon in the top-right corner of the Alarm Console.
This icon lights up in blue to indicate that DataMiner Analytics found something interesting. For more detailed info, see Working with the Alarm Console light bulb feature.
Click the menu item 2 anomalies were found in your trend data (this can also be a higher number if your system has detected anomalies on other elements).
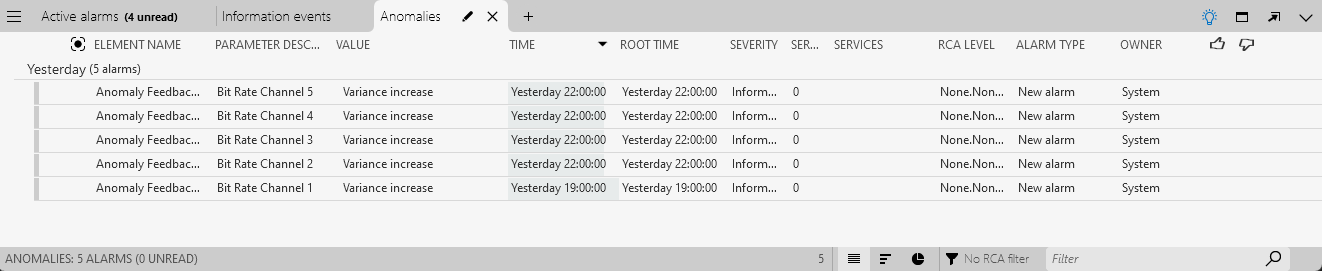
A new Anomalies tab will now be shown in the Alarm Console, listing the two detected anomalies.
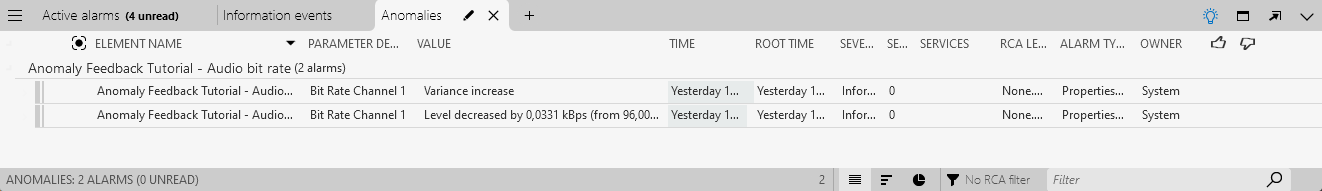
In the Value column of the Alarm Console, similar to the trend graph, you will see that the detected level shift was very small:
Level decreased by 0.0331 kBps (from 96.0089 kBps to 95.9758 kBps). This corresponds to a drop of approximately 0.003 kBps.The reason such a small drop was detected is that, although minor, it exceeds the variability of the parameter before the drop. However, a drop of this size is unlikely to be relevant to an operator. Therefore, you want to remove this anomaly, while still keeping the variance change to detect other instances of switching between CBR and VBR encoding.
To give negative feedback to the level shift anomaly, hover the mouse pointer over the suggestion event in the Anomalies tab and click
 in the
  column.
Anomaly detection will learn from this feedback, making it less likely to trigger similar anomalies in the future. This applies to the same parameter instance, other instances of the parameter within the same table, and other elements using the same protocol.
Optionally, you can clear the suggestion event by clicking the light bulb next to the
button and selecting Clear event.The light bulb displays suggested follow-up actions based on your feedback. More actions will be explained later. Clearing the alarm does not affect how your feedback is processed by anomaly detection, but it does clean up your Alarm Console.
A single instance of negative feedback is insufficient for anomaly detection to learn effectively. So, you will repeat the feedback process a few times:
Go to the DATA page of the Anomaly Feedback Tutorial - Audio Bit Rate element.
Click the Generate 3 Channels button to generate three more audio channels with data similar to the first one, each with a variance change and a level shift anomaly.
In the Alarm Console, give the level shifts detected for Bit Rate Channel 2, Bit Rate Channel 3, and Bit Rate Channel 4 negative feedback, and optionally clear them using the light bulb icon.
On the DATA page of the Anomaly Feedback Tutorial - Audio Bit Rate element, generate an additional audio channel by pressing Generate Single Channel. For this channel, only a variance change is generated and no level shift because DataMiner's anomaly detection has learned from the previously submitted feedback that level shifts of this size are not interesting.
Click
next to the Channel 5 parameter in the Audio Channels table.
In the trend graph, you can see that a level shift was still detected. However, the change point below the bit rate drop is light gray this time, which indicates a lower level of importance, meaning it is not marked as an anomaly. So, while the change is still detected, it is no longer seen as unexpected by DataMiner.
Tip
For more information about the difference between change points and anomalies, see Working with behavioral anomaly detection.
Step 3: Fine-tune anomaly detection
In the previous step, you used negative feedback to remove certain anomalies detected for a bit rate parameter of an audio encoder. In this step, you will use both negative and positive feedback to fine-tune which anomalies DataMiner detects for a parameter monitoring the download bit rate in a terrestrial network.
Select the element Anomaly Feedback Tutorial - Average Download Bit Rate in the Surveyor.
This element simulates parameters monitoring the average download bit rate in a terrestrial network for each sector (i.e. per town or neighborhood). This bit rate can fluctuate over time, depending on the level of traffic generated by connected households or companies. However, a significant sudden drop may indicate an outage.
Click the Generate Data button to generate data for a network sector.
Open the trend graph for the bit rate of the newly generated network sector channel by clicking
next to the Sector 1 parameter in the Network Sectors table.As expected, the download bit rate fluctuates significantly but gradually over the past week. However, in the last hour, the bit rate drops by 15 Mbps. This drop is detected as an anomaly. You can tell DataMiner detects this as anomaly because of:
The dark gray block displayed below the drop in the trend graph.
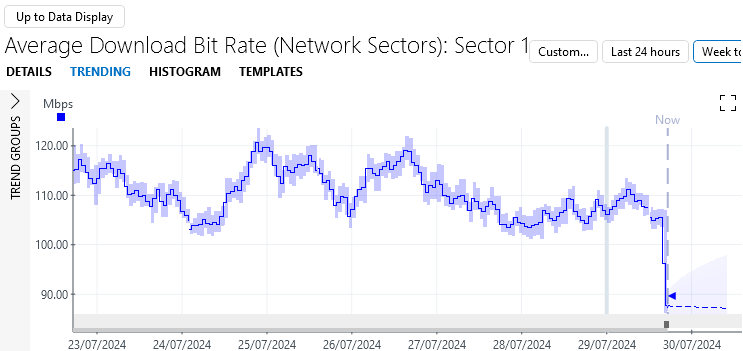
The level shift entry in the Anomalies tab of the Alarm Console.

While the drop is significant and caught by anomaly detection, 15 Mbps may not be large enough to cause concern in this context. Similar to the previous step, you want to prevent this anomaly from being flagged, but you still want to be notified of larger drops in the future.
In the Anomalies tab of the Alarm Console, hover the mouse pointer over the level shift anomaly detected for the Average Download Bit Rate Sector 1 parameter and select
in the column.This negative feedback will help the anomaly detection learn and make it less likely to trigger similar anomalies in the future. However, significantly larger drops will still be detected.
On the DATA page of the Anomaly Feedback Tutorial - Average Download Bit Rate element, click the Generate Data button again to generate data for a new network sector.
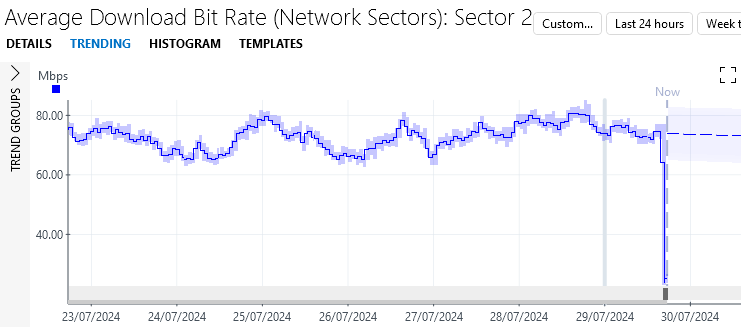
Open the trend graph for the bit rate of the newly generated network sector channel by clicking
next to the Sector 2 parameter in the Network Sectors table.The data looks similar, but this time a much larger drop of approximately 50 Mbps occurs at the end, which could indicate a network problem. You will want to be notified about such larger drops in the future.
In the Anomalies tab of the Alarm Console, hover the mouse pointer over the level shift anomaly detected for the Average Download Bit Rate Sector 2 parameter and select
 in the column.
By providing different feedback for smaller and larger drops, DataMiner's anomaly detection will gradually learn which sizes of drops you want to be notified about.
On the DATA page of the Anomaly Feedback Tutorial - Average Download Bit Rate element, click the Generate Data button twice to generate data for two more network sectors.
Both network sector 3 and 4 experience only small drops in bit rate.
In the Anomalies tab of the Alarm Console, hover the mouse pointer over the level shift anomaly detected for Average Download Bit Rate Sector 3 and Average Download Bit Rate Sector 4 and select
in the column.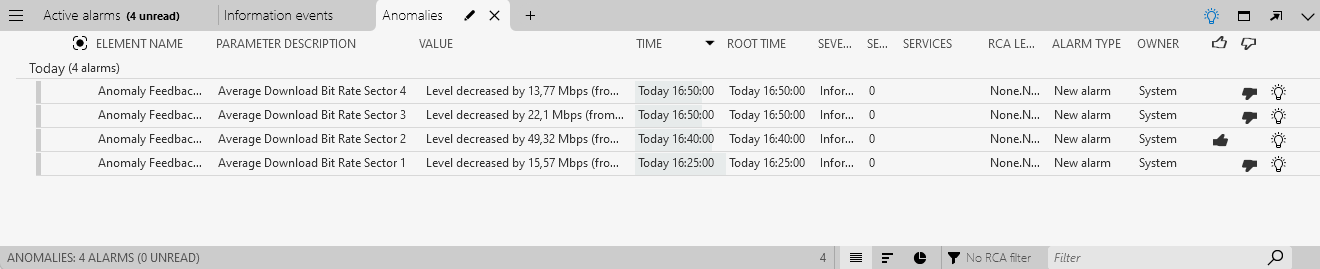
On the DATA page of the Anomaly Feedback Tutorial - Average Download Bit Rate element, click the Generate Data button to generate data for a fifth network sector.
You will see in the trend graph that network sector 5 experiences another small drop in bit rate. However, this time, no anomaly is generated for this size of decrease.
On the DATA page of the Anomaly Feedback Tutorial - Average Download Bit Rate element, click the Generate Data button to generate data for a sixth and final network sector.
This sector experiences a large drop, and an anomaly is generated for it.
This demonstrates that DataMiner's anomaly detection algorithm has learned when to generate an anomaly based on your feedback.
Tip
You can easily check whether a parameter has a change point or an anomaly within the last hour by looking at the trend icons displayed in front of the parameters. These icons show the type of change point detected, if any, while their color indicates whether the change point was marked as an anomaly. See Working with trend icons for more information.
![]()
Step 4: Use suggested improvements for alarm templates
As mentioned earlier, a light bulb icon may appear next to the and icons after you give feedback. This light bulb proposes certain follow-up actions based on your feedback. For example, in Step 2, you used it to clear a suggestion event.
In this step, you will use the light bulb feature to configure an alarm template for anomalies. This will help you achieve similar results as in Step 3, while requiring less feedback and giving you more control over the process.
Select the element Anomaly Feedback Tutorial - Task Manager in the Surveyor.
This element simulates the Windows Task Manager, monitoring the memory usage of several processes. You want to be notified if this memory usage suddenly spikes.
By right-clicking the element in the Surveyor and selecting Protocols & Templates > View alarm template 'Template', you will see that the element has an empty template associated with it. This allows DataMiner to suggest template improvements based on your feedback.
Click the Generate Data button to generate data for a first process.
Open the trend graph for the memory of the newly generated process by clicking
next to the Google Chrome parameter in the Task Manager table.You will see that the memory usage has fluctuated over the past week but remained stable overall. In the last hour, however, there is a significant spike. As indicated by the dark gray square below the trend graph and the entry in the Alarm Console, this jump has been detected as an anomaly.
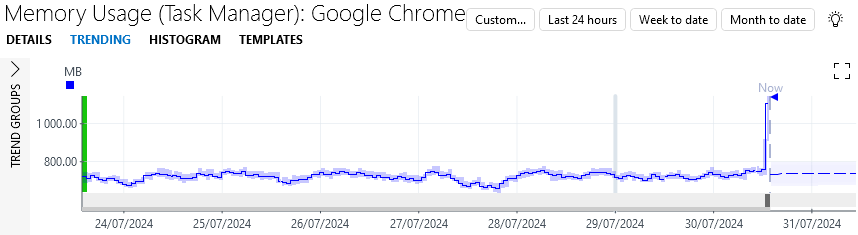
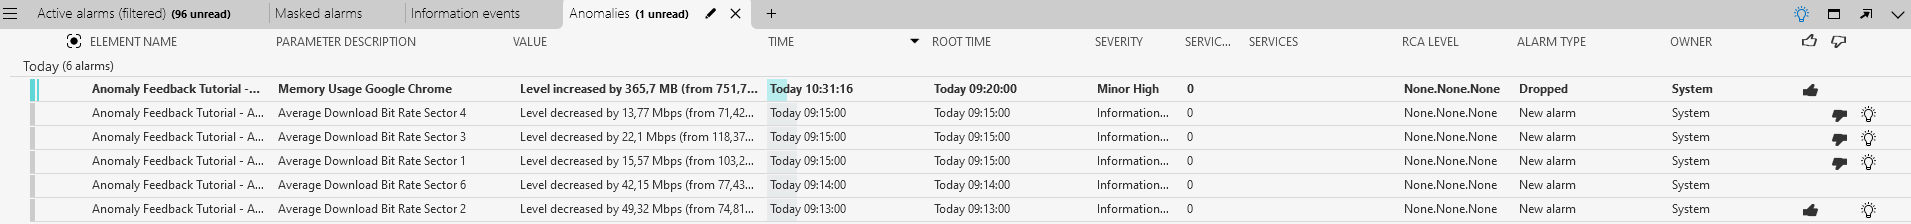
Since this is the kind of anomaly you want to be notified of, go to the Anomalies tab in the Alarm Console, hover the mouse pointer over the level shift anomaly detected for Memory Usage Google Chrome, and select
in the column.
Click the light bulb icon next to the
column.Select Improve alarm template from the list of follow-up actions.
This will open a pop-up window with a proposed configuration for your anomaly alarm template, including suggested improvements to the anomaly alarms settings.
In this case, it suggests enabling smart alarming for level increases, as you just provided positive feedback for this type of anomaly. This means that, in the future, an alarm will be generated when this type of anomaly is detected, rather than just a suggestion event.
Accept the suggested improvement by clicking Update alarm template in the lower right corner of the pop-up window.
The suggestion event now becomes a real alarm.
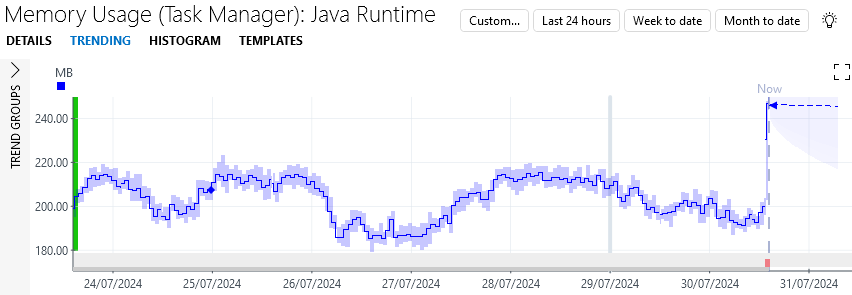
On the DATA page of the Anomaly Feedback Tutorial - Task Manager element, click the Generate Data button to generate data for a second process, Java Runtime.
Open the trend graph for the memory usage of Java Runtime by clicking the
icon.The data again ends with an upward spike, but this time it is smaller. However, DataMiner still detects it as an anomaly, and because you enabled smart alarming for level increases, a critical alarm is generated.
In the Anomalies tab of the Alarm Console, hover the mouse pointer over the level shift anomaly detected for the Memory Usage Java Runtime parameter and select
in the column.Click the light bulb icon next to the
column and select Improve alarm template.A pop-up window appears with a proposed configuration for your anomaly alarm template, suggesting setting an absolute threshold of 200 MB for level increases. This ensures that level increase anomalies will only be generated if the memory usage spikes by 200 MB or more. The threshold is based on your previous feedback, allowing alarms for large increases like Google Chrome while filtering out smaller ones like Java Runtime.

Accept the suggested improvement by clicking Update alarm template in the lower right corner of the pop-up window.
The alarm for the Java Runtime process now disappears, while the alarm for the Google Chrome process changes to critical.
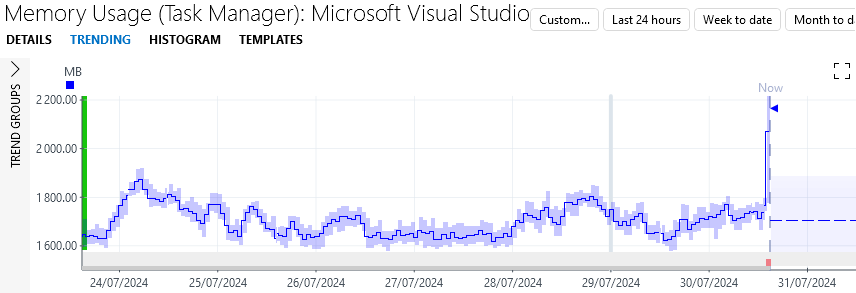
On the DATA page of the Anomaly Feedback Tutorial - Task Manager element, click the Generate Data button a third time to generate memory usage data for the Microsoft Visual Studio process.
Click the
icon next to Microsoft Visual Studio to open the trend graph for the memory usage of this process.This jump is large in absolute terms (just over 400 MB) but small relative to the initial value of 1750 MB, representing an increase of about 23%.
In the Anomalies tab of the Alarm Console, hover the mouse pointer over the level shift anomaly detected for the Memory Usage Microsoft Visual Studio parameter and select
in the column.Click the light bulb icon next to the
column and select Improve alarm template.This time, a relative threshold of 40% is proposed, meaning that anomaly alarms will be generated whenever the size of the jump is greater than 40% of the starting value. This relative threshold satisfies both your negative feedback on this last jump and on the smaller jump for Google Chrome. While the jump for Google Chrome was large relative to its initial value, the jumps for Java Runtime and Microsoft Visual Studio were small.
Tip
Select the clock icon on the Level increases row to compare the proposed configuration to the currently active configuration.
To accept the suggested improvement, select Update alarm template in the lower right corner of the pop-up window.
The alarm for the Microsoft Visual Studio process disappears, while the alarm for the Google Chrome process remains.
On the DATA page of the Anomaly Feedback Tutorial - Task Manager element, click the Generate Data button two more times to generate data for the Explorer and Microsoft Excel processes.
An anomaly alarm is generated for the Explorer process, as a level increase of approximately 200% occurs (from 50MB to 150 MB).
No anomaly is generated for the Microsoft Excel process, as a level increase of approximately 15% occurs (from 150 MB to 175 MB).
Step 5: Final exercise (optional)
In this final step, you will repeat Step 3, but this time, you will provide different feedback, leading to a different result.
For this exercise, use the element Anomaly Feedback Tutorial - Average Download Bit Rate 2. This element will generate the same data as Anomaly Feedback Tutorial - Average Download Bit Rate, but it uses a different protocol name, which allows you to start fresh with a clean slate. Additionally, it has an empty alarm template configured so that you can receive suggestions to improve the alarm template.
The goal of this exercise is to configure the system to trigger alarms or suggestion events for downward jumps greater than 20 Mbps, but not for jumps smaller than 20 Mbps. You can choose to use feedback alone, or combine feedback with the suggested alarm template improvements, as explained in Step 4.
If you are a member of the DevOps Program and you have completed the exercise above, send us screenshots of the alarm console with the feedback you gave to earn DevOps Points.
Use the following email format:
- Subject: Tutorial - Anomaly Feedback Tutorial
- To: ai@skyline.be
- Body:
- Dojo account: Clearly mention the email address you use to sign into your Dojo account, especially if you are using a different email address to send this email
- Feedback (optional): We value your feedback! Please share any thoughts or suggestions regarding this tutorial or the anomaly detection feature.
- Attachment:
- A screenshot of the Anomalies tab in the Alarm Console with the feedback you provided for the anomalies.
Skyline will review your submission. Upon successful validation, you will be awarded the appropriate DevOps Points as a token of your accomplishment.
Important
We want to keep improving our Behavioral Anomaly Detection capabilities, and your feedback is very helpful for this. That is why you can also earn DevOps Points by sending us good examples of detected anomalies and/or situations where the anomaly detection can be improved (e.g. no anomaly was detected, or an anomaly was detected for something that is not problematic).
Use the following email format to send us your examples:
- Subject: Tutorial - Anomaly detection feedback
- To: ai@skyline.be
- Body:
- Dojo account: Clearly mention the email address you use to sign into your Dojo account, especially if you are using a different email address to send this email.
- Feedback: Provide a short explanation of what is shown in the examples you are sending us and why the detected anomaly is good or bad.
- Attachment:
- A picture of the trend graph with the detected anomaly.
- An export of your trend graph, obtained by right-clicking the trend graph and selecting Export to CSV.
Skyline will review your submission. Upon successful validation, you will be awarded the appropriate DevOps Points.