View cards
To open a view card, click the view in the Surveyor.
View card header and footer
In the header of a view card, a breadcrumb trail is shown. In this header, you can:
Navigate to a parent item by clicking it in the breadcrumb trail.
Click the triangle to the right of an item to drill down to its child items.
If card footers are enabled, the footer of a view card displays the following:
On the left, icons represent the number of elements and services in each alarm state.
On the right, the alarm distribution in the last 24 hours is displayed. When you double-click this section, the reports tab of the view card is displayed.
Tip
See also: Card settings
View card pages
The navigation pane on the left side of a view card contains a tree view with the following items:
VISUAL
Under the VISUAL node, one or more pages are displayed that contain a graphic representation of the view. These can be completely customized in Visio.
Note
For more information on how to change the Visio file linked to a particular view, see Switching between different Visio files.
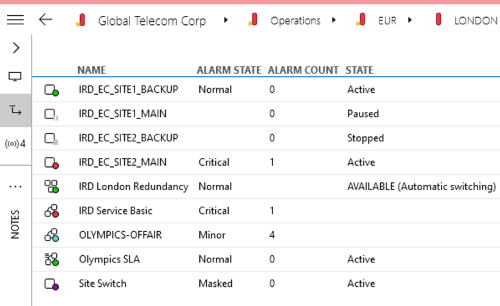
BELOW THIS VIEW
Under the BELOW THIS VIEW node, there is a page for each type of item that can be contained within the view. Next to the item name, a number is displayed that indicates how many of these items are in the view. Click a page in the tree view to display a list of the items in question.
BELOW THIS VIEW page in DataMiner 10.5.4
The data pages can be displayed in several ways. You can change the way they are displayed by means of the buttons in the lower right corner of the page.
| Button | Description |
|---|---|
 |
Filters the view to show only certain items. If you click the button, a pane is displayed in which you can select which items should be displayed. To show items from subviews as well, select the checkbox click All devices (Include sub-views). Note that the number of items indicated next to the DATA pages can change depending on whether this filter is selected. |
 |
Displays the list view. |
 |
Displays the summary view. |
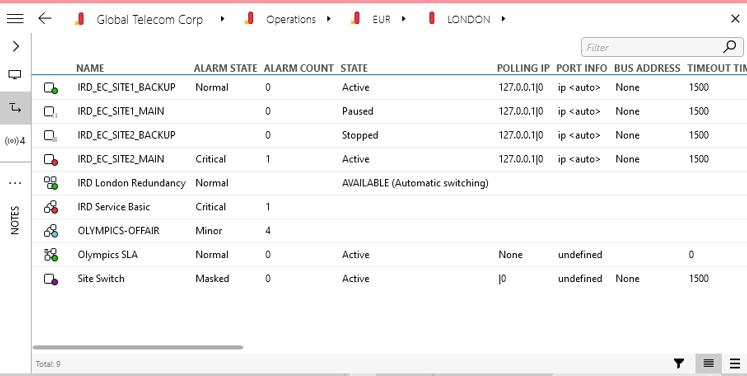
List view
In the list view, a detailed list of the items in the view is displayed, with information such as the name, alarm state, alarm count, protocol, alarm and trend template, ID, etc. The information is automatically updated when objects in the view are added, updated or deleted.
List view in DataMiner 10.4.5
The list can be manipulated to display data according to your preference:
Click a column header to sort the list.
Click the same column header again to reverse the sort order.
Click and drag a column header to change the order of the columns.
Use the filter box in the top-right corner to filter the displayed items.
Tip
See also: Using quick filters
The list consists of the following columns:
Name: The name of the item.
Alarm state: The current alarm state of the item.
Alarm count: The current number of alarms on the item.
State: The current status of the item. For an element or SLA, this can be active, paused or stopped. For an overview of the possible states of a redundancy group, see Checking the current state of a redundancy group.
Polling IP: Relevant for elements only. The IP address used to communicate with the data source, if any.
Port info: Relevant for elements only. The port used to communicate with the data source, if any.
Bus address: Relevant for elements only. The bus address of the data source, if any.
Timeout time: Relevant for elements only. The timeout time for a single request for each of the element’s connections (in milliseconds). For multiple connections, the values are separated by commas.
Element timeout time: Relevant for elements only. The total timeout time for each of the element’s connections (in milliseconds). This is the timeout time that corresponds with the element setting The element goes into timeout state when [...] (see Adding elements). For multiple connections, the values are separated by commas.
Slow poll: Relevant for elements only. The number of milliseconds that each of the element connections has to be in timeout before they are placed in slow poll mode. For multiple connections, the values are separated by commas. For more information on slow poll mode, see Adding elements.
# of retries: Relevant for elements only. The total number of times DataMiner will send the same command again in case it does not receive a response. For multiple connections, the values are separated by commas.
Protocol and Protocol version: Relevant for elements and SLAs only. The name and version of the protocol used for communication between the DMA and the data source.
Alarm template: Relevant for elements and SLAs only. The name of the alarm template used for alarm monitoring of the element or SLA.
Trend template: Relevant for elements and SLAs only. The name of the trend template used for trending of the element or SLA.
Protocol type: Relevant for elements and SLAs only. Type of the protocol, e.g. serial, snmp, virtual, sla, etc.
Communication protocols: Relevant for elements only. The communication protocols used by the element, e.g. Serial. Displayed from DataMiner 10.2.0/10.2.1 onwards.
ID: The unique ID of the item, which consists of the ID of the DMA where the item was created and the ID of the item itself, separated by a forward slash.
Host ID: The ID of the DMA hosting the item.
DataMiner: The name of the DMA hosting the item.
Type: Relevant for elements and SLAs only. Type of item as defined in the protocol, e.g. Matrix, IRD, Service Level Agreement, etc.
Display type: Relevant for elements only. The display type as defined in the protocol, i.e. spectrum analyzer for spectrum analyzer elements or element manager for EPM elements.
IP: The virtual IP of the element in DataMiner, if any.
Description: The user-defined description of the element, if any.
Impacted services: The services the item is included in, if any.
SLA service: Relevant for SLAs only. Indicates the service monitored by the SLA.
Isolation mode: Available from DataMiner 10.4.0 [CU15]/10.5.0 [CU3]/10.5.6 onwards. Relevant for elements only. Indicates whether the element is running in isolation mode. Possible values include:
None: Not applicable. For example, when viewing the All page of a service.
Disabled: The element is not running in isolation mode.
Enabled (protocol): Isolation mode is enabled via the protocol.xml file and applies to all elements using this protocol version.
Enabled (element): Isolation mode is enabled via the element’s own settings.
Enabled (DMA): Isolation mode is enabled via a DMA-wide setting that applies to all elements using the protocol.
Note
By default, this column is hidden. To display it, right-click a column header and select Add/Remove setting column > Isolation mode.
Additional columns with user-defined properties can be added or removed via the column header context menu.
Summary view
In the summary view, you can choose to view one of four different lists showing limited information about the items in the view. The lists are automatically updated when items in the view are added, updated or deleted.
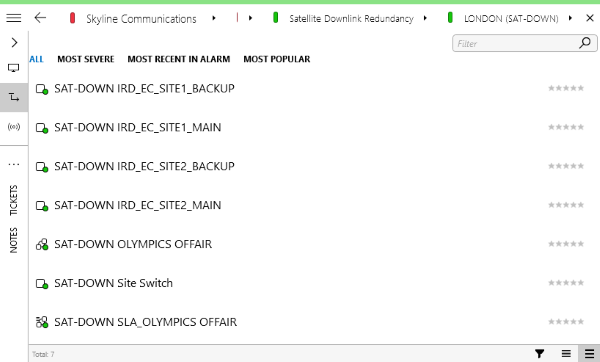
Summary view in DataMiner 10.4.5
| List | Description |
|---|---|
| All | All items in the view. |
| Most severe | Only the items with the most severe alarm states. |
| Most recent in alarm | Only the items that have recently been put in an alarm state. |
| Most popular | The items that are frequently being viewed. |
View card shortcut menu
When you right-click an item on a view card data page, a shortcut menu appears, allowing you to do several actions such as:
Open an element or service in an existing card, a new card or a new undocked card.
Note
You can also quickly open an item in a new card by clicking the item with the middle mouse button.
Set the state of an element.
See Element states.
Mask an element.
Perform a multiple set on elements.
View properties for an element or service.
Add an element or service to a dashboard.
See Adding an item to a dashboard from outside the Dashboards app.
ALARMS
This page displays all alarms related to the view, in the default Alarm Console layout.
Tip
See also: Working with the Alarm Console
REPORTS
A graphic representation of the alarm distribution, alarm events and alarm states, as well as a heatmap for the view’s child items (on systems using Storage as a Service or a self-managed Cassandra-compatible database). You can set the period for which data are shown to the last 24 hours, one week to date, or one month to date.
Tip
See also: Viewing the reports page on a card
DASHBOARDS
This page links to the legacy DMS Dashboards module.
Note
The legacy Dashboards module is by default disabled from DataMiner 10.4.0/10.4.1 onwards. If you want to keep using this module, you need to enable it with the LegacyReportsAndDashboards soft-launch option. Prior to this, starting from DataMiner 10.2.0/10.1.12, the legacy Dashboards module can optionally be disabled with this soft-launch option.
AGGREGATION
This page shows any aggregation rules that were found for the view. The different aggregation rules are listed in the left column, details are shown in the right column.
Tip
See also: Working with aggregation rules
HISTOGRAM
On this page, trending information for a parameter can be displayed in a histogram, across different elements.
For more information, see Viewing trend information in a histogram on a view card.
TRENDING
The options on this page are very similar to those in the main Trending module.
However, on this page you can view trending for a parameter of a particular protocol across different elements.
To do so:
Click Add parameter in the gray pane at the bottom of the card.
Select a protocol, version and parameter, and in case of a table parameter an index.
If you do not want to include elements from subviews, clear the checkbox next to Include subviews (recursion).
If you do not want to display trending for a particular element, click the x to the right of that element.
Click Show trend to show the trend graph for the parameter.
To show more than one parameter in the trend graph, simply repeat the procedure above.
To remove parameters from the trend graph, you can:
Click the x to the right of each parameter you want to remove.
Click Clear all, to remove all parameters.
Tip
See also: Accessing trend information from the Trending module
Note
Trend groups added on view cards are not displayed in the main Trending module, and vice versa.
NOTES
On this page, you can add short notes to the view. For more information, see Card navigation pane.
ANNOTATIONS
On this page, you can add, view and edit extensive annotations to the view. With the pencil icon on this page, you can open an HTML editor that allows you to add text, hyperlinks, pictures, etc. to the annotations. There is also an icon that can be used to print the annotations, and an icon to refresh the annotations page.
Note
The Annotations module is by default disabled from DataMiner 10.4.0/10.4.1 onwards. If you want to keep using this module, you need to enable it with the LegacyAnnotations soft-launch option. Prior to this, starting from DataMiner 10.2.0/10.1.12, Annotations can optionally be disabled with this soft-launch option.