Using Visual Overview to control dashboard feed components
In this tutorial, you will learn how to feed data into a dashboard URL in order to automate selections on feed components when the dashboard is opened. The data to be fed into the URL will be defined on an element's visual overview through the clever use of shape data.
Expected duration: 45 minutes
Note
The content of this tutorial has been created with DataMiner web apps version 10.4.1.
Prerequisites
DataMiner version 10.2.2 or higher
Protocol: Skyline Generic Virtual Connector – version 1.0.0.3 or higher
Microsoft Visio
Overview
Note
The data being interacted with in the example below originates from elements using the Skyline Generic Virtual Connector protocol. However, this process will work for elements using any protocol that features table-based parameters.
Step 1: Create a new Virtual Connector element and add numerical data to the 'Numerical Master Table' on the element's 'Table' data page
Open DataMiner Cube.
Create a new element using the Skyline Generic Virtual Connector protocol.
Open the Surveyor.
Right-click a view (e.g. the root view), and select New > Element.
Enter an element name, select the DMA, the protocol (i.e. Skyline Generic Virtual Connector) and the protocol version (e.g. 1.0.0.3), and click Create.
Go to the DATA > Table page of the newly created element, which contains the Numeric Master Table.
Right-click below the table's column headers, and click Add to add a new row to the table.
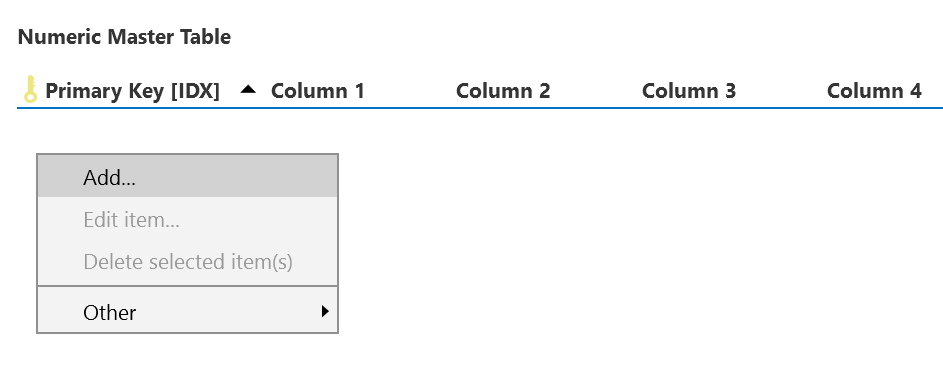
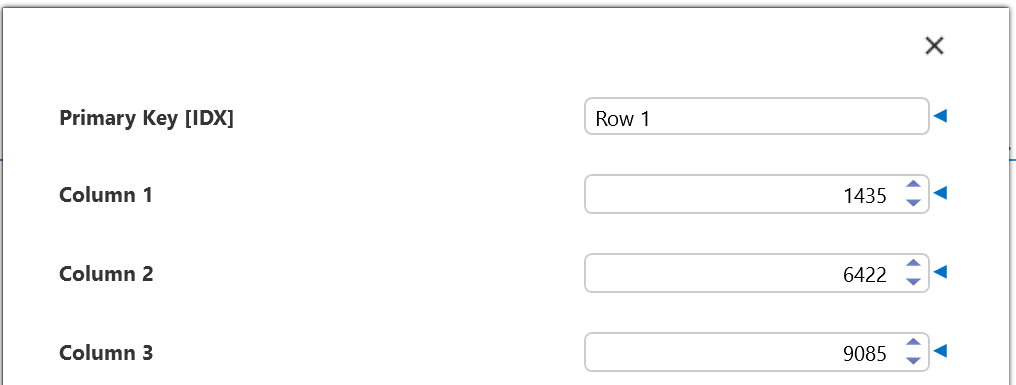
Enter the row's primary key [IDX], enter random numbers into the first three columns, and click OK.
Important
Do not use any special characters for the primary key, as they will interfere with the URL linking later in this tutorial.
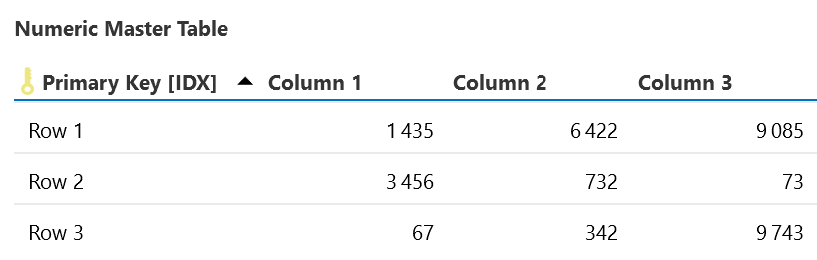
Add at least one more row to the table.
Step 2: Create a new dashboard and add a 'Parameter feed' component and a 'State' component to display the numerical data from the Virtual Connector
Open the Dashboards app.
If you are not yet in edit mode, then click Start editing.
Add a Parameter picker component.
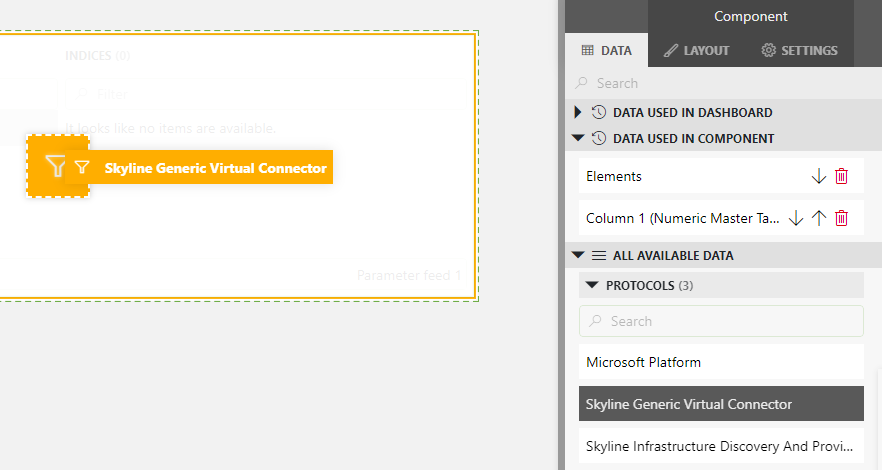
From the Data pane on the right, drag the ELEMENTS header onto the Parameter feed component to be used as data.
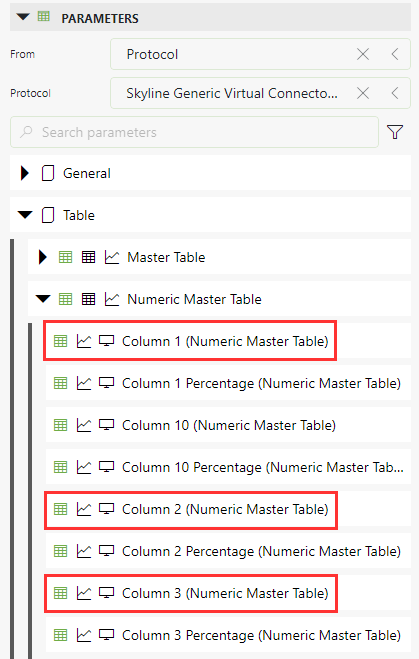
From the Data pane on the right, add the necessary parameters:
Expand the PARAMETERS section.
Set From to "Protocol".
Set Protocol to "Skyline Generic Virtual Connector".
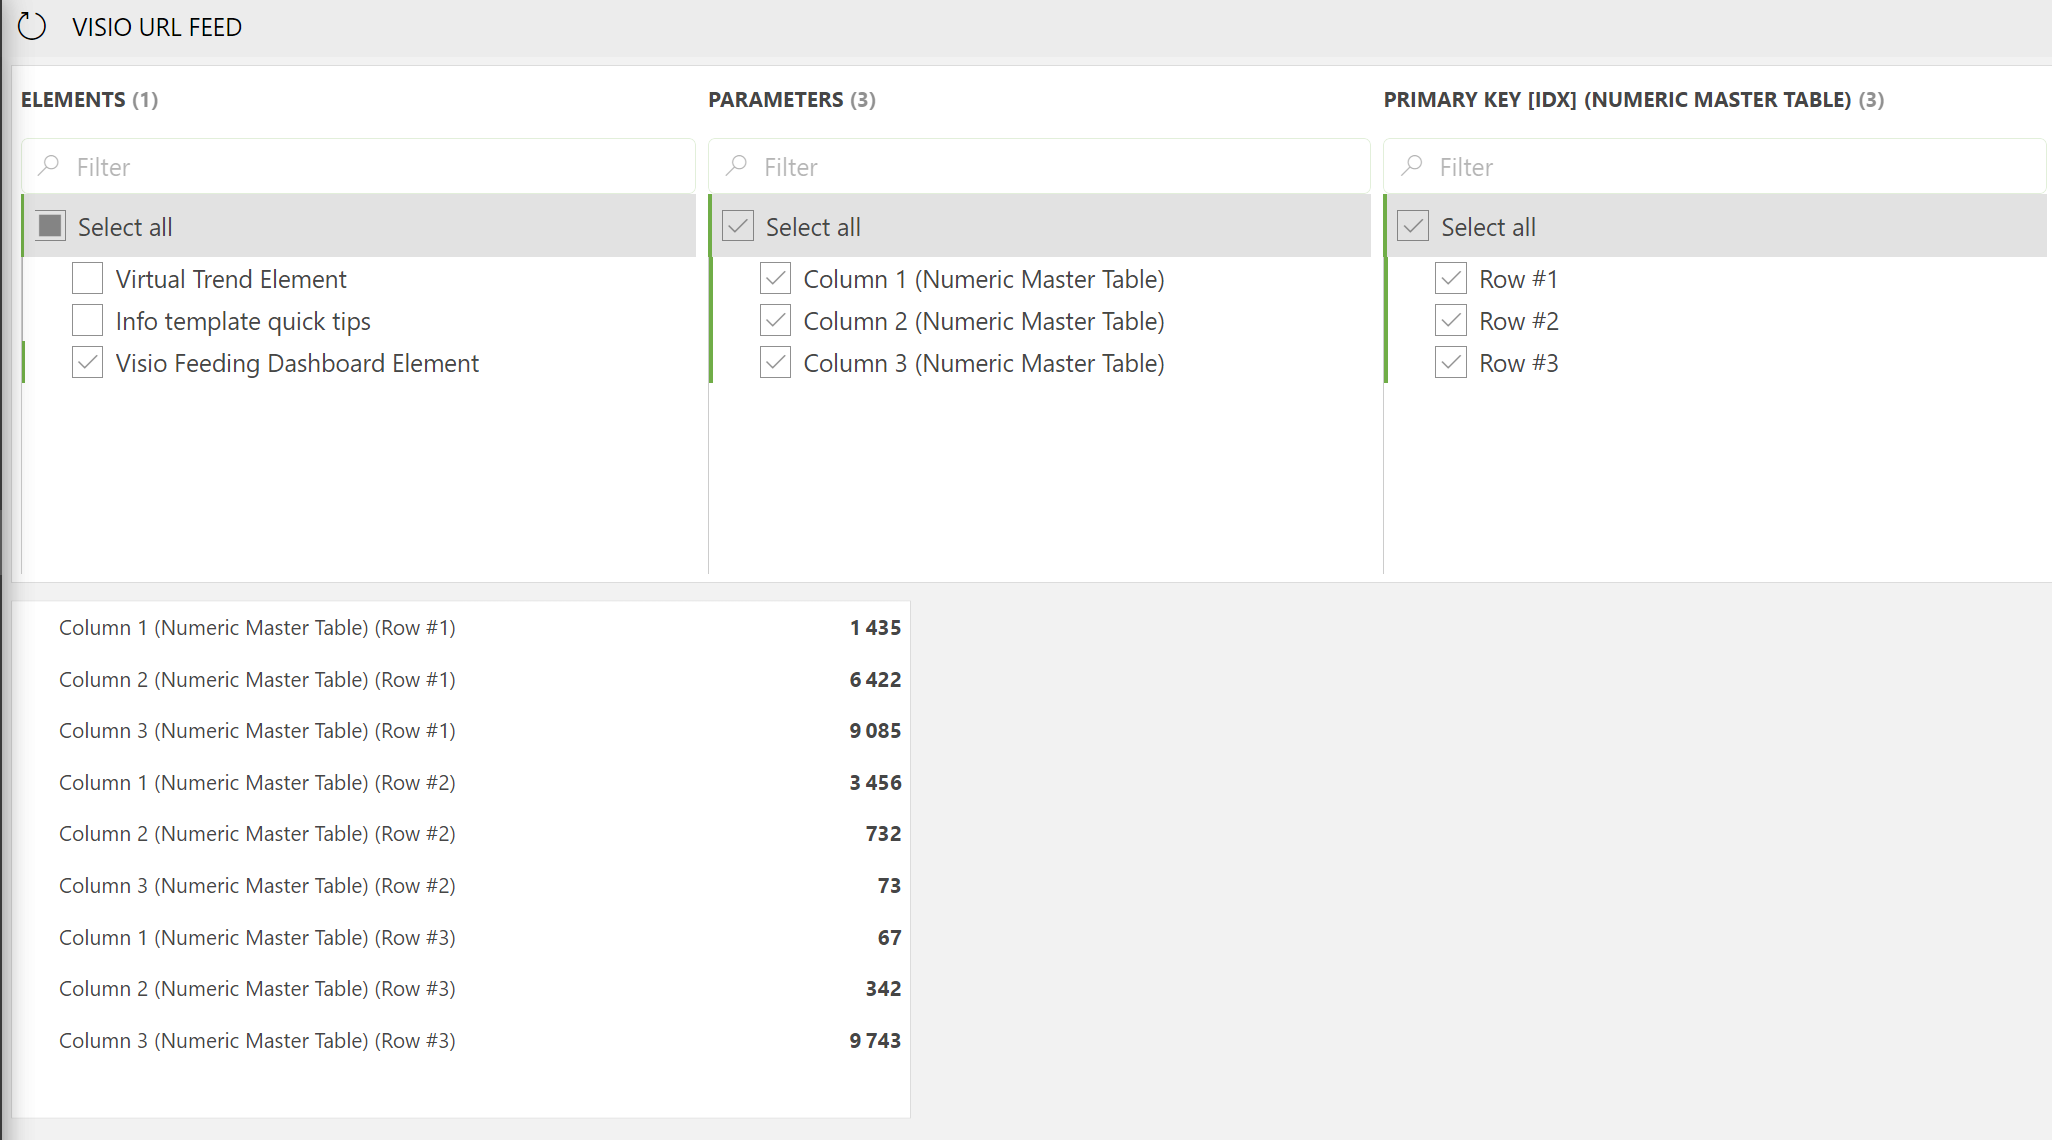
Use the filter to find the three numeric table parameters that you entered numbers for.
Drag each of these parameters onto the Parameter feed component to be used as data.
From the Data pane on the right, add a protocol filter:
Expand the PROTOCOLS section.
Search for the Skyline Generic Virtual Connector.
Drag the protocol onto the Parameter feed component to be used as a filter.
Add a State component.
Click the State component to select it.
From the Data pane on the right, add the Parameters feed:
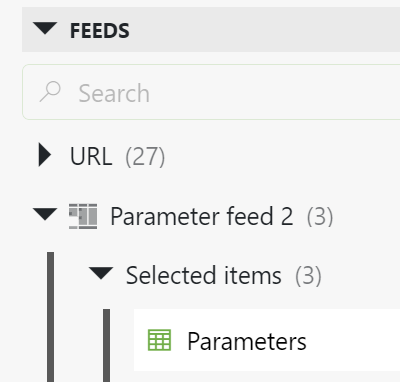
Expand the FEEDS section to find the items associated with the parameter feed.
Expand the Parameter feed component.
Drag the Parameters item onto the State component to be used as data.
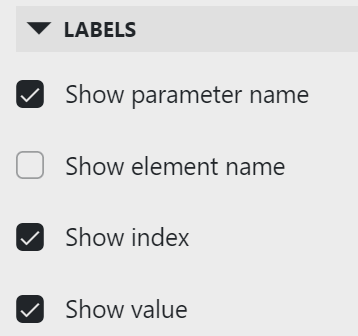
In the Layout pane on the right, select the LABELS boxes to display the parameter name, the index, and the value.
Click Stop editing to exit edit mode.
At this point, you should be able to make manual parameter feed selections to control which parameter values are shown on the State component.
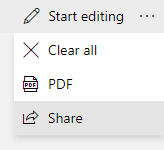
In the top-right corner of the screen, click the ellipsis button, and then click Share.
In the pop-up window, enable the Use uncompressed URL parameters option, and then click Copy link.
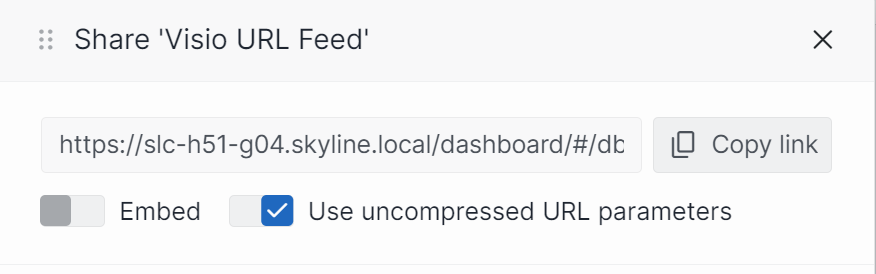
The URL you copied will be used later in this tutorial.
Close the pop-up window by clicking the "X" in the top-right corner.
Step 3: Create a new visual overview for the Generic Virtual Connector element with shapes for each numerical table index linking to the dashboard
In DataMiner Cube, open the Generic Virtual Connector element you created earlier in this tutorial.
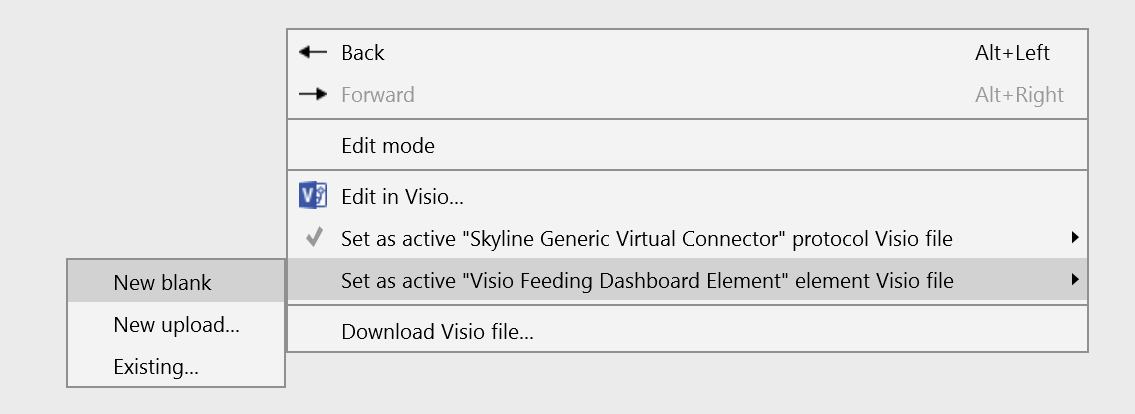
Go to the VISUAL page of the element, and right-click anywhere to have the Visio file options displayed.
Hover the mouse pointer over Set as active "..." element Visio file, and click New blank.
In the confirmation box, click Yes.
A new Visio file associated with the element will now be created. It will look like a blank canvas on the VISUAL page of the element.
If the new Visio file is not opened automatically, on the blank VISUAL page, right-click anywhere, and select Edit in Visio.
This will open Microsoft Visio.
Note
When you make changes to the Visio file, they will immediately appear in DataMiner Cube as soon as you save the file.
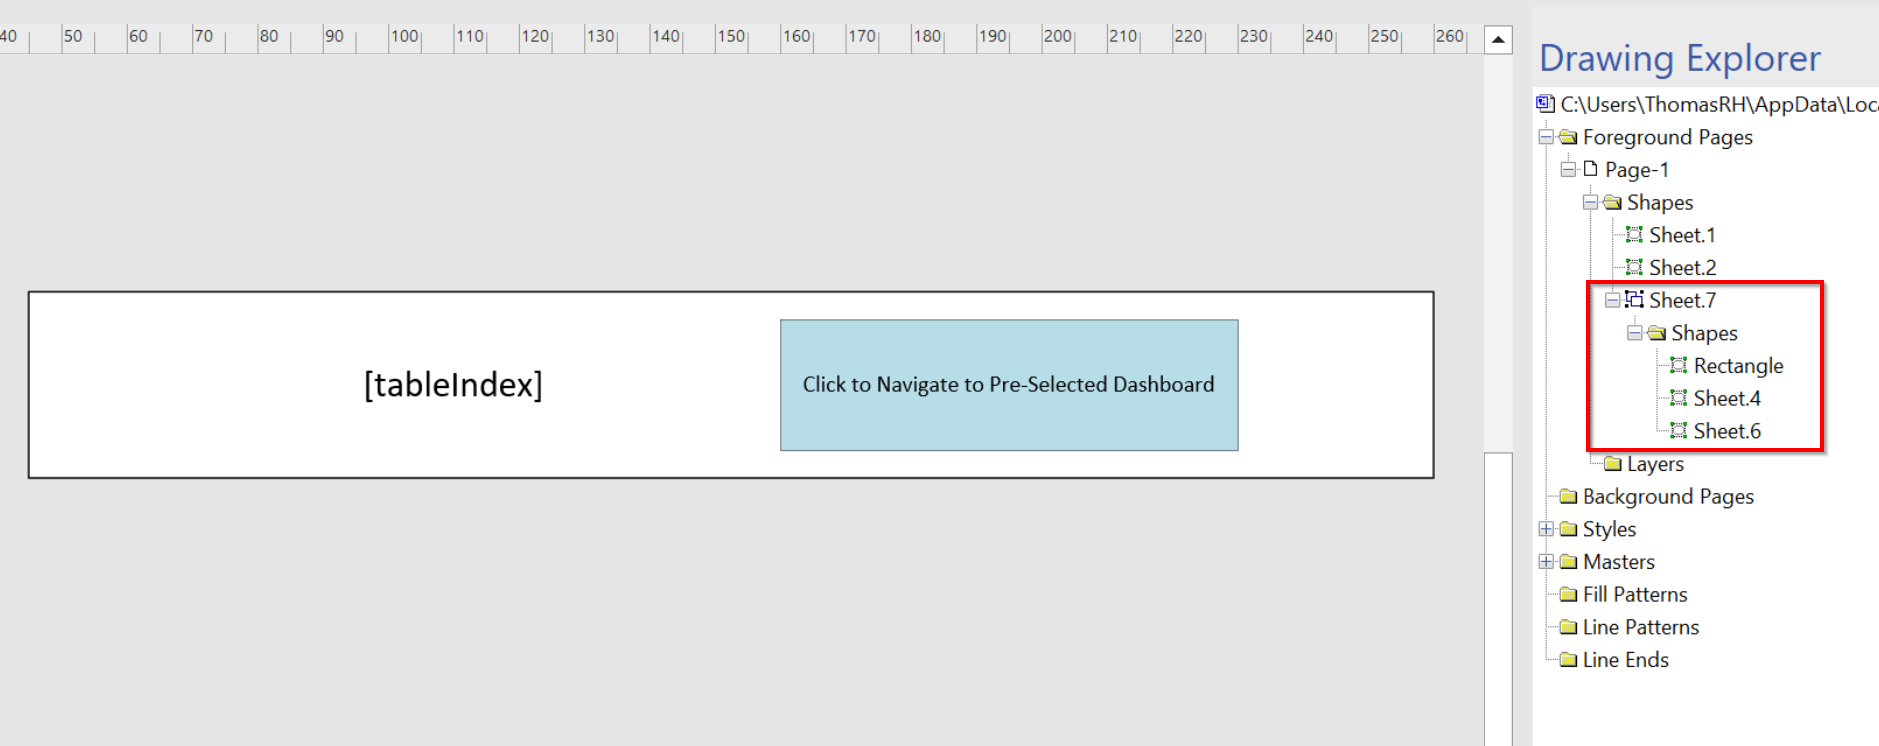
Add a large rectangle that represents a table row.
Add a textbox with the text [tableIndex], and move it on top of the rectangle.
Add a button to navigate to the Dashboards app:
Add a small rectangle shape.
Double-click the rectangle, and give it a useful description.
Move the rectangle on top of the first rectangle representing a row.
Ctrl-click all three components to select them all, then right-click, and select Group > Group.
You should see the following under the Drawing Explorer:
Note
If the Drawing Explorer is not automatically displayed, follow these steps:
Right-click the ribbon and select Customize the Ribbon.
In the Main Tabs list on the right, make sure Developer is enabled.
Click OK in the lower right corner.
Access the Developer tab, and select the Drawing Explorer check box in the Show/Hide group.
The Drawing Explorer window will become available in the corner of your drawing.
Right-click the grouped sheet representing a row, select Shape Data, and add the following shape data:
Shape data field Value ChildType Row ChildMargin 5 Ctrl-click the grouped sheet representing the row and the existing background sheet that came with the new Visio file to select both, then right-click, and select Group > Group.
Add the following shape data to the larger grouped sheet:
Shape data field Value Children Row ChildrenSort Name ChildrenPanel Stack ChildrenSource [this element]/1200 Note
[this element] is a dynamic placeholder, and 1200 is the table parameter ID of the Numeric Master Table.
Using a publicly available web-based encoded JSON URL converter, convert the URL you copied earlier to a human-readable format.
This will make it easier to understand how feed selections are represented in the dashboard's URL.
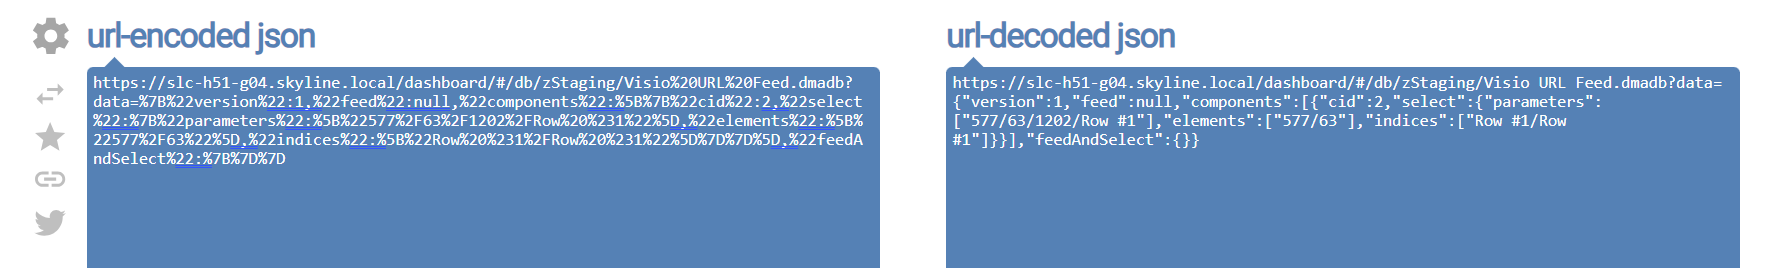
Replace sections of the URL with placeholders to allow dynamic entry based on the row index that is fed into it:
http://<DMAIP>/dashboard/#/db/zStaging/Visio%20URL%20Feed.dmadb?data={"version":1,"feed":null,"components":[{"cid":2,"select":{"parameters":["[cardVar:_elementId]/1202/[tableIndex]","[cardVar:_elementId]/1203/[tableIndex]","[cardVar:_elementId]/1204/[tableIndex]"],"elements":["[cardVar:_elementId]"],"indices":["[tableIndex]/[displaytableIndex]"]}}],"feedAndSelect":{}}Note
The first part of the URL (i.e. the part on the left of the question mark) needs to be changed to match the naming structure of your dashboard. The component ID (
cid) also needs to be changed to match that of your parameter feed. You can find the ID of each component in the lower right corner of the component while in edit mode.Again use a web-based encoded JSON URL converter, this time to convert the URL back to encoded JSON.
Add the following shape data to the button shape.
Shape data field Value Enabled true Link The URL with encoded JSON Make sure nothing is selected in the Visio drawing, and add the following shape data to ThePage:
Shape data field Value InitVar _elementId:[This ElementID] This is needed to initialize the card variable that is used in the URL.
Save the Visio file.
For each table row that was added in step 1, a child shape should now be displayed on the visual overview of the Generic Virtual Connector element. Each shape will have its own button that, when clicked, will open the dashboard that was created in step 2. Depending on the button that was clicked, the URL will be fed with the appropriate table index information so that the parameter feed on the dashboard automatically selects the index associated with the button's row, and the State component will display the corresponding results.